Listen and subscribe
Apple  Android
In this week’s episode, Dave, Cate and Pete take you through:
- How long has it taken property prices to double?
After last week’s show when The Property Buyer prodded for more retrospective data, the Property Professor shares his research in Part B of how long it’s taken property prices to double for the previous decade, starting from March 2002. While Sydney took first place for the most recent 10 years, they are dead last for the previous 10, while Hobart takes the cake and required only 3 years to double in value during this particular decade.
- September growth posts solid results amid an easing growth rate
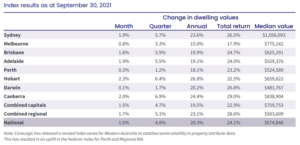
Australian housing values increased a further 1.5% in September, after 1.5% in August and 1.6% in July. Annual housing growth has finally cracked the 20% mark, with September’s results pushing the annual figure to 20.3%, which is now the fastest pace since June 1989.
- Perth and Hobart surprise
Astonishingly, the Hobart unit market continues to surprise. Values in Hobart have risen 26.8% over the last year, while the unit segment has risen 31%. Perth has reappeared in CoreLogic data after a short hiatus while CoreLogic investigated some inconsistencies. Annual figures for Perth show 18% growth at the end of September, which is a large jump from the 10.8% noted in July’s index results.
- Rents continue to rise towards rental crisis
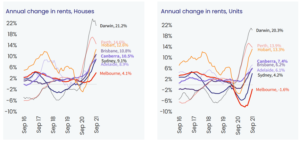
The lowest performer in the rental market is Melbourne, which is up 4.1% for houses and still in negative territory for units at – 1.6%. Other capital cities record results of rental increases between 4% and 15%, while Darwin is at 21.2% increase in rents for houses and 20.3% for units. Some people may argue that we have a housing crisis on our hands.
- The best cure for rising housing prices is rising housing prices
The more house prices increase, the more unaffordable they become. By this fact alone, the rate of growth will slow down and we’re already starting to see that. It’s also another reason why we’re seeing the value of unit growth converge again in line with house price growth, as people who are priced out of the housing market, turn to units. Other factors include the cost of funding for lenders increasing, which we will start to see through rising interest rates and also APRA intervention to slow down lending. If the RBA don’t increase rates until the start of 2024, these factors will make it harder to borrow money and the property market will likely demonstrate an ease in the pace of growth in 2022.
- Consumer confidence – time to buy a dwelling
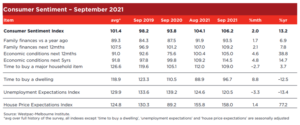
Overall, people still think that it’s slightly a negative time to buy a dwelling, as the index reached 96.7 points in September, recovering from 88.9 in August. The Index is still 26.8% below its November peak of 132, but it is closer to the 100 mark, which suggests a more balanced view. WA is a stand out at 118.8, they are very optimistic about it being a good time to buy a property. Queensland is at 105, but Victoria is the lowest and the most pessimistic about the property market at 87.3.
- Growing gap between Melbourne and Sydney medians
Melbourne’s median is only 73% of Sydney’s. Melbourne didn’t trade at all during lockdowns, except for those who were willing to purchase sight unseen. This disparity is likely to condense over time and we wouldn’t be surprised if we saw this discrepancy tighten towards the end of the year and in the years to come.
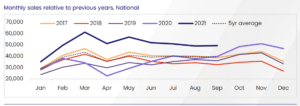
- Listings – new listings, total listings and monthly sales
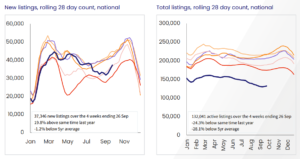
New listings and total listings have taken a dive. On the other hand, monthly sales relative to previous years is really strong, which is telling a story of enormous buyer appetite, with very limited levels of stock remaining. As Melbourne and Sydney come out of lockdown, you will see more listings in the market, but also more buyers will come back into the property market.
- Predictions for the rest of the year
The Property Professor puts the Property Buyer and Property Planner on the spot, for their predictions for the rest of 2021. Tune in for their forecasts.
Resources
- How to develop your own property plan – start with the end in mind (#4)
- What determines your property strategy (#6)
- Time in the market vs Timing the market (#19)
- Why the family home is often the biggest piece of the investment puzzle (#22)
- The great debate! Capital Growth v Cash flow – which investment strategy is superior? (#56)
- Preparing for auction #2 (#98)
- The winner’s curse and how to avoid it (#94)
- The Seven secret steps to buying a house (#93)
- Property Planning your next purchase – critical considerations and why modelling financial outcomes is vital to success (#92)
- Goal setting fundamentals for property success (#82)
- Why your Mortgage Strategy is more important than your interest rate! (#9)
- How to succeed with Property and Create your Ideal Lifestyle
- Mortgage Strategy 101 – YouTube video series.
Gold nuggets
Cate Bakos – The Property Buyer’s Golden nugget: how to use CoreLogic data when applying capital growth to less recent sales. Having the table of growth in front of you for the last months in front of you is helpful. The data is only on averages, so there are some nuances. As a bare minimum, overlay the growth rate and anticipate how much the market has moved on the comparable sales. You may be finding that your budget is insufficient. Make sure you look at the date it was purchased, not the day it was settled. REA may be more helpful than Domain in this respect. Being honest with yourself, particularly in a rising market, you will cost yourself a lot of money just chasing the market.
David Johnston – The Property Planner’s Golden nugget: how the upper quartile tends to lead the market. If we head into a downturn, the upper quartile will be the first to drop and will drop the furthest. If we go into an upturn, they grow the fastest and the earliest. In the three months to May, the upper quartile grew 12%, but this premium segment of the market has only grown by 6% in the last 3 months. Another indicator that the rate of growth is starting to slow down.


