1. Home Value Index Results
CoreLogic – (Data published 1 June 22)
A. National values
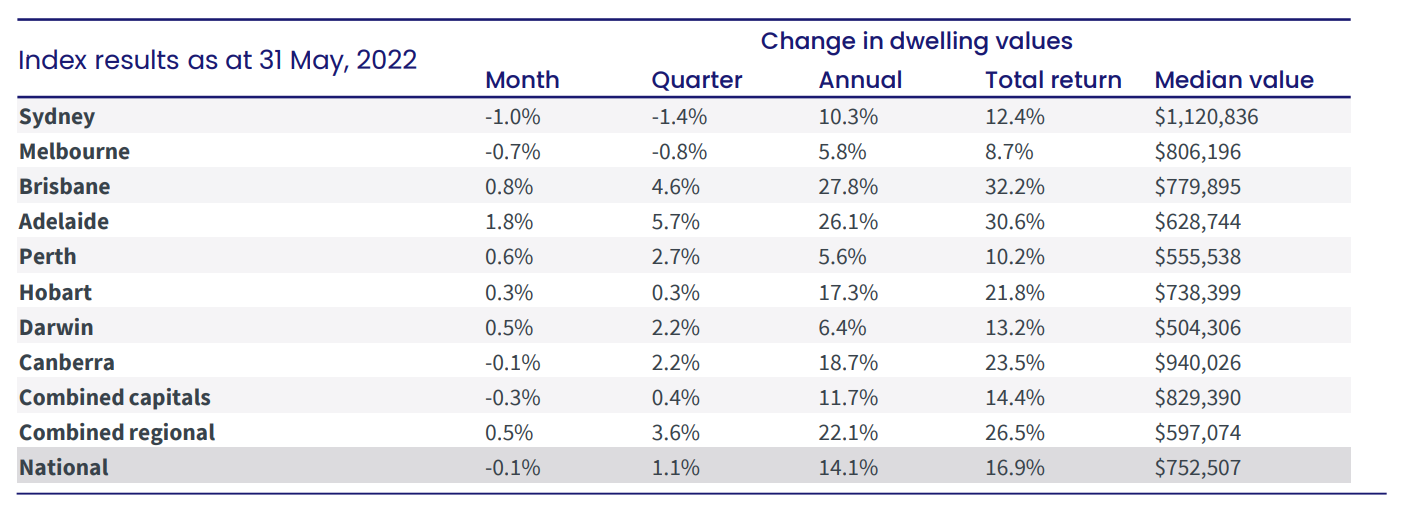
- First monthly decline in the National Index since September 2020 – negative 0.1%
- Housing markets lost more steam in May as a combination of higher interest rates, rising inventory levels and lower sentiment dampened conditions.
- Canberra recorded its first monthly decline since July 2019
- Canberra housing values remain 37.9% higher vs. pre-pandemic levels
- Sydney has been recording progressively larger monthly value declines since February
- Since peaking in January, Sydney housing values are down -1.5%, but remain 22.7% above pre-COVID levels
- Melbourne has fallen across four of the past six months
- experienced a softer growth phase, has recorded a smaller peak-to-date decline of -0.8%, with housing values now 9.8% higher compared to the pre-COVID level
- Outside of Sydney, Melbourne and Canberra, growth trends remained positive in May, albeit with less momentum in most markets.
- Perth and Adelaide were the exceptions, where the quarterly growth trend lifted in May, although both regions remain below the peak quarterly rate of growth.
Annual growth trends
- Annual change – Above 20% – Brisbane 27.8%, Adelaide 26.1%, Combined regional 22.1%
- Annual change – below 20% – Canberra 18.7%, Hobart 17.3%, Sydney 10.3%, Darwin 6.4%, Melbourne on 5.8%, and Perth 5.6%
B. Month Highlights
Growth over May
- National – negative 0.10%
- Combined capitals – negative 0.3% after 0.3% last month
- Combined regionals – 0.5% after 1.4% last month
- Adelaide – 1.8% after 1.9% last month
- Brisbane – 0.8% after 1.7% last month
- Perth – 0.6% after 1.1% last month
- Darwin – 0.5% after 0.9% last month
- Hobart – 0.3% after 0.3% last month
- Canberra – negative 0.1% after 1.3% last month
- Melbourne – negative 0.7% after 0.0% last month
- Sydney – negative 1.0% after negative 0.2% last month
Median values – ALL DWELLINGS
- National – $752,507
- Combined capitals – $829,390
- Combined regional – $597,074
- Capitals –
- Sydney – $1,120,836
- Canberra – $940,026
- Melbourne – $806,196
- Brisbane – $779,895
- Hobart – $738,399
- Adelaide – $628,744
- Perth – $555,538
- Darwin – $504,306
C. Regions
- Whilst continuing to demonstrate stronger growth conditions, regional Australia has also come off peak growth rates Mr Lawless said, with the annual growth trend easing to 22.1%, down from its January peak of 26.1% and likely to trend lower through the rest of the year.
- “Considering we are already seeing the pace of growth easing across most regional markets, it is likely we will see growth conditions softening in line with higher interest rates and worsening affordability pressures,” he said.
- “Arguably some regional markets will be somewhat insulated from a material downturn in housing values due to an ongoing imbalance between supply and demand as we continue to see advertised stock levels remain extraordinarily low across regional Australia.”
2. Rents
CoreLogic – (Data published 1 June 22)
Nationally
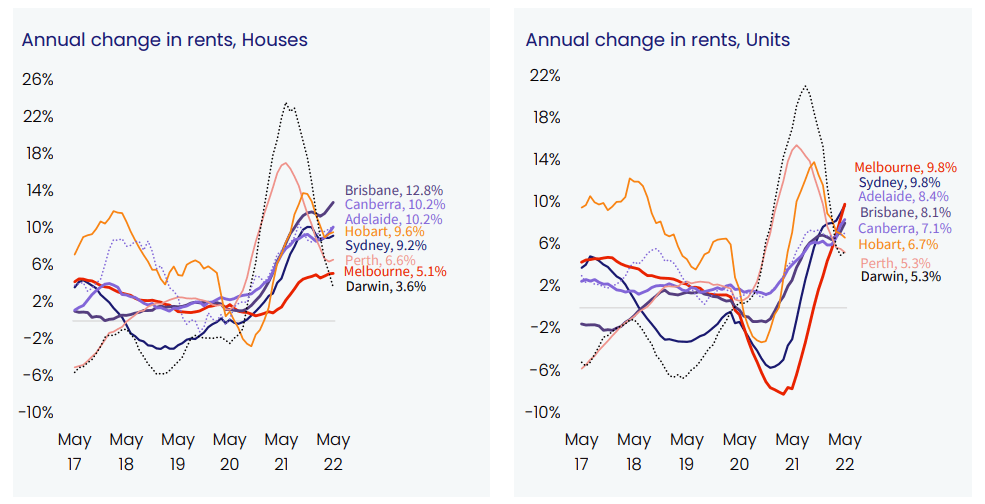
- While housing value growth has slowed, rents continue to rise swiftly.
- Nationally, CoreLogic’s Hedonic Rental Index increased 1.0% in May,
- taking the quarterly rate of growth to 3.0%, up 60 basis points on a year ago.
- The annual change in rents is now tracking at
- 8% across the combined capital cities and
- 8% across the combined regions.
Houses vs units
- Unit rents are rising at a faster annual pace than house rents across
- the combined capital cities – house rents increased 8.6% compared to 9.1% across units
- the combined regional areas – where house rents rose 10.7%, behind the 11.0% gain in units
- “Early in the pandemic rental demand for medium to high density dwellings fell sharply due to a preference shift towards larger homes and a demand shock from closed international borders,” Mr Lawless said.
- “As rental affordability pressures mount, demand for higher density rentals has steadily grown due to the unit sectors’ relative affordability advantage.
- More recently, demand has been boosted by international arrivals returning to the rental market.”
Rental yields
- Amidst rising rents and a general easing in home value growth, yields are recording some upwards momentum, especially in Sydney and Melbourne.
- Sydney gross rental yields are up from a record low of 2.42% in December last year to 2.59%,
- Melbourne yields have increased from a record low of 2.74% in December to 2.86%.
- “Despite the upwards trajectory, yields remain remarkably low in both cities, but a recovery back to average levels may be relatively quick if housing values continue to fall while rents maintain this growth trajectory,” said Mr Lawless.
3. Vacancy rates
SQM (Data published 17 May)
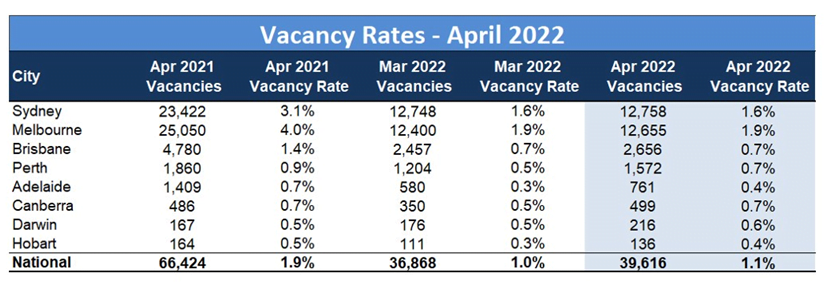
- National residential property rental vacancy rates rose slightly to 1.1% in April, from 1.0% in March.
- Sydney, Melbourne and Brisbane vacancy rates remained stable
- In the smaller capital cities, Perth, Adelaide, Canberra, Darwin and Hobart, rental conditions eased somewhat with vacancy rates increasing in each respective city; albeit conditions remained tight.
- Melbourne has the highest vacancy rate of 1.9% – no change from March
- Melbourne CBD – rose from 2.4% to 2.9%
- Sydney with second highest vacancy at 1.6% – no change from March
- Sydney CBD – rose from 3.4% to 3.5%
- Then Brisbane, Perth, Canberra – 0.7%
- Darwin – 0.6%
- Adelaide, Hobart – 0.4%
4. Listings
CoreLogic – (Data published 1 June 22)
TOTAL listings
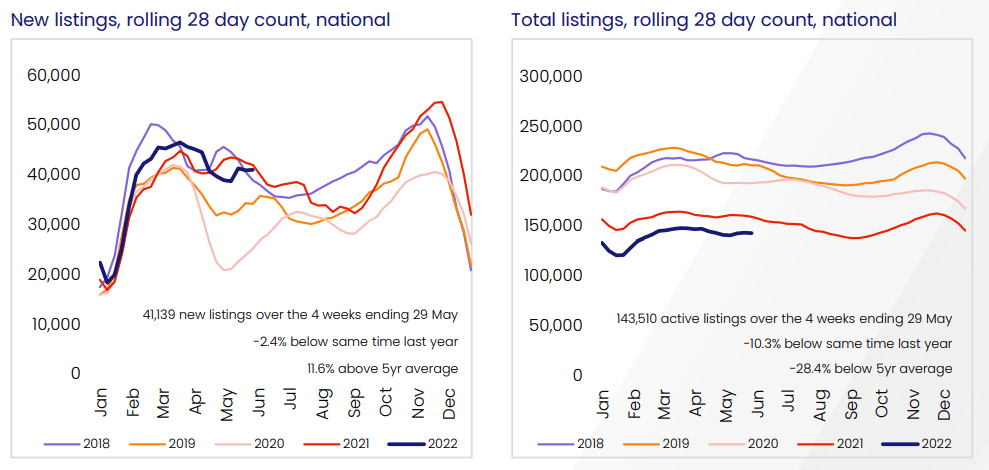
- The trend in advertised stock levels helps to explain the weaker conditions across Sydney and Melbourne.
- Nationally, advertised stock levels remain -10.3% below levels seen this time last year and -28.4% below the previous five-year average.
- However, inventory in Sydney and Melbourne are now higher than 12 months ago and against the five-year average.
- Sydney’s advertised listings are 5.1% higher than a year ago and 1.5% above the five-year average.
- Melbourne’s advertised stock levels are up 1.3% on last year and 8.1% above average based on the previous five years.
- “With stock levels now higher than normal across Australia’s two largest cities, buyers are back in the driver’s seat,” Mr Lawless said.
- “Higher listings add to tougher selling conditions more broadly.
- Vendors in Sydney and Melbourne have faced lower auction clearance rates since mid-April and those selling via private treaty are taking longer to sell with higher rates of discounting.”
- Outside of Sydney and Melbourne, stock levels remain below average, especially in the cities where housing values are rising the fastest:
- Adelaide (-39.5%),
- Brisbane (-38.2%) and
- Perth (-34.7%)
all have advertised stock well below the five-year average.
- While advertised stock levels provide some insight about the supply side of the market, home sale volumes provide guidance on housing demand.
- Sydney recorded the largest drop in estimated home sales, down -33.4% in the three months to May compared to the same period in 2021.
- Canberra (-21.6%) and
- Melbourne (-21.3%)
also recorded significant reductions in activity.
- “Our estimate of homes sales nationally over the three months to May is -19.2% below the same period a year ago, but still 12.1% above the five-year average,”
- Mr Lawless noted. “A combination of higher interest rates, lower rates of household saving and a potentially more cautious lending environment is likely to reduce housing demand further just as total advertised stock levels are likely to continue rising, further empowering buyers by creating increased competition amongst vendors.”
NEW listings
- Over the year listings are down 6% nationally
- Largest decrease in Canberra 19.6%, Melbourne 14.1% and Sydney 13.6%
- Hobart increase of 23.75%
- New listings decreased for most capitals in May
- Hobart 28.2%
- Canberra 10.6%
- Melbourne 6.7%
- Sydney 4.8%
- Darwin 8%
- Brisbane 0.7%
- Despite the weaker selling conditions, vendors were far from being forced to sell, Mr Christopher said.
- “Sellers or property owners can afford the current rate rise and probably be able to afford the rate increases we’re about to have,” he said.
- “I don’t think we’ll see a big rise and forced sales activity until we see the average lending rate get above and beyond 6 per cent.
- “At this point in time, there are no signs that vendors are being panicked into selling, and I think we’re going to see many would-be sellers hold back until they believe that the downturn has come to an end.”
OLD listings
- Increased 0.9% in May, and down 36.3% over the year nationally
- All capital cities (bar Darwin) listings have decreased in the last 12 months – Canberra 67.3%, Brisbane 57.3% and Adelaide 53.3% with the highest decreases
- Over the month:
- Brisbane the only capital that saw a reduction in old listings
- Old listings rose sharply in Sydney and Melbourne in May as vendors struggled to find a buyer within a reasonable timeframe amid falling demand, data from SQM Research shows.
- The number of Sydney homes sitting on the market for six months or longer surged by 9.6 per cent to 4032 in May,
- Melbourne by 6.2 per cent to 6378.
- Perth, rising by 3.4 per cent to 4032.
- Canberra, they went up by 4.8 per cent to 219
- in Hobart by 13.3 per cent to 213.
- The number lifted slightly in Adelaide and Darwin
- But dropped by 5.5 per cent in Brisbane.
- The build-up in older listings will put further pressure on prices as the housing market moves into a correction
- SQM Research managing director Louis Christopher said older listings would increase further as interest rates rose and fewer buyers could enter the market.
- “Older stock levels are likely to increase from here because there’s a wide gap between buyers and sellers at the moment,” he said.
- In Sydney’s inner west, the number of homes sitting on the market for at least six months jumped by 18.6 per cent.
- In the eastern suburbs it climbed by 11.4 per cent and on the northern beaches by 24 per cent.
- Old stock in inner east Melbourne rose by 5 per cent and in north-west Melbourne by 11 per cent.
5. Consumer sentiment – time to buy a dwelling and house price expectations
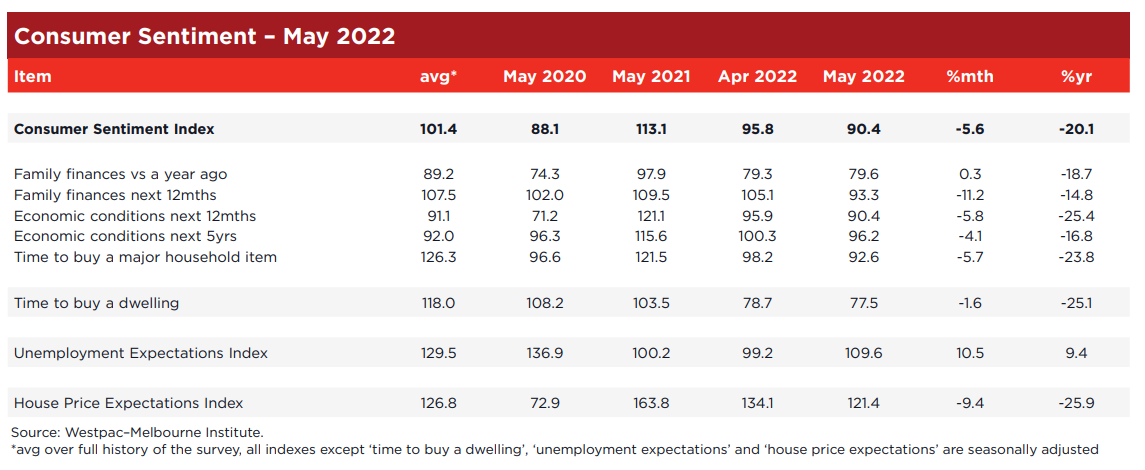
Westpac Melbourne Institute (Data published 11 May 22)
A. House price expectations index
- Drop to 121.4 points, after 134.1 in April
Comments from Westpac Melbourne
- The outlook for house prices is starting to deteriorate more rapidly.
- The Westpac Melbourne Institute Index of House Price Expectations fell by 9.4% to 121.41.
- Most respondents still expect house prices to rise over the next year – indicated by an index read above 100.
- The latest read compares to the consistent sub-100 prints seen in 2018 and 2019 when house prices were correcting by 12–15% in the Sydney and Melbourne markets.
- While all major state indexes saw declines, the largest was in Queensland (–22%) which was coming off a very positive 154.8 in April.
- Falls in other states were more modest – Victoria (–6.2%); NSW (–4.5%) and WA (–5.4%).
- The indexes in Victoria (112.7) and NSW (116.9) are now well below the national average (121.41).
B. Time to buy a dwelling index
- Drop to 77.5 points, after 78.7 in April
- From July 2021 the index has been hovering from the low 80’s to high 90’s.
Comments from Westpac Melbourne
- The ‘’time to buy a dwelling’ index, which was already 40% below its most recent peak in November 2020, fell a further 1.5% in May.
- The Index, which is principally affected by affordability, is now at its lowest level since April 2008 when, due to rising inflation, the RBA felt obliged to raise rates in both February and March despite the looming Global Financial Crisis.
- Today’s report highlights the sensitivity of Australian households to higher rates and rising inflation.
6. Lending indicators
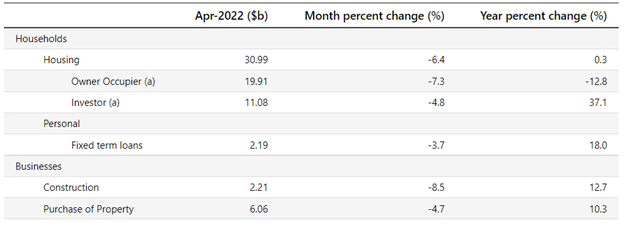
ABS (Data published 3 June 2022)
April
- Fell 6.4% for Housing overall
- Fell 7.3% for owner occupier
- Fell 4.8% for investor
- First home buyers fell 6.2%
New loan commitments – very little change from previous month
- % of Owner Occ – 64.24% (down from 64.8% in March)
- % of Investors – 35.76% (up from 35.2% in March)
- % of first time buyers (as % of owner occ) – 23.75% (up from 23.6% in March)
Investor levels still below where APRA stepped in at 46% in 2015
7. Unemployment
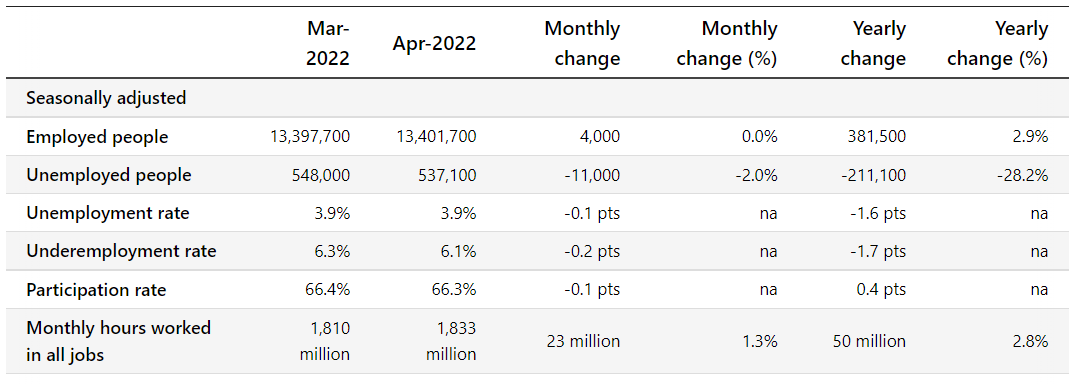
ABS (data published 19 May 2022)
April
- Unemployment rate remained 3.9%
- Reductions in unemployment in NSW, SA, WA, Tas, ACT
- Underemployment rate decreased to 6.1% after 6.3% in March
- Reductions in NSW, QLD, SA, WA
- Participation rate reduced to 66.3% after 66.4% in March
- Increases in VIC, NT
8. RBA announcement
At its meeting, the Board decided to:
- At its meeting today, the Board decided to increase the cash rate target by 50 basis points to 85 basis points.
- It also increased the interest rate on Exchange Settlement balances by 50 basis points to 75 basis points.
RBA minutes
Inflation and interest rates
- Inflation in Australia has increased significantly.
- While inflation is lower than in most other advanced economies, it is higher than earlier expected.
- Global factors, including COVID-related disruptions to supply chains and the war in Ukraine, account for much of this increase in inflation.
- But domestic factors are playing a role too, with capacity constraints in some sectors and the tight labour market contributing to the upward pressure on prices.
- The floods earlier this year have also affected some prices.
- Inflation is expected to increase further, but then decline back towards the 2–3 per cent range next year.
- Higher prices for electricity and gas and recent increases in petrol prices mean that, in the near term, inflation is likely to be higher than was expected a month ago.
- As the global supply-side problems are resolved and commodity prices stabilise, even if at a high level, inflation is expected to moderate.
- Today’s increase in interest rates will assist with the return of inflation to target over time.
- Today’s increase in interest rates by the Board is a further step in the withdrawal of the extraordinary monetary support that was put in place to help the Australian economy during the pandemic.
- The resilience of the economy and the higher inflation mean that this extraordinary support is no longer needed.
- Given the current inflation pressures in the economy, and the still very low level of interest rates, the Board decided to move by 50 basis points today.
- The Board expects to take further steps in the process of normalising monetary conditions in Australia over the months ahead.
- The size and timing of future interest rate increases will be guided by the incoming data and the Board’s assessment of the outlook for inflation and the labour market.
- The Board is committed to doing what is necessary to ensure that inflation in Australia returns to target over time.
Aus economy
- The Australian economy is resilient, growing by 0.8 per cent in the March quarter and 3.3 per cent over the year.
- Household and business balance sheets are generally in good shape, an upswing in business investment is underway and there is a large pipeline of construction work to be completed.
- Macroeconomic policy settings are supportive of growth and national income is being boosted by higher commodity prices.
- The terms of trade are at a record high.
Labour market
- The labour market is also strong.
- Employment has grown significantly and the unemployment rate is 3.9 per cent, which is the lowest rate in almost 50 years.
- Job vacancies and job ads are at high levels and a further decline in unemployment and underemployment is expected.
- The Bank’s business liaison program continues to point to a lift in wages growth from the low rates of recent years as firms compete for staff in a tight labour market.
Household spending/saving
- One source of uncertainty about the economic outlook is how household spending evolves, given the increasing pressure on Australian households’ budgets from higher inflation.
- Interest rates are also increasing.
- Housing prices have declined in some markets over recent months but remain more than 25 per cent higher than prior to the pandemic, supporting household wealth and spending.
- The household saving rate also remains higher than it was before the pandemic and many households have built up large financial buffers.
- While the central scenario is for strong household consumption growth this year, the Board will be paying close attention to these various influences on consumption as it assesses the appropriate setting of monetary policy.
Global outlook
- The Board will also be paying close attention to the global outlook, which remains clouded by the war in Ukraine and its effect on the prices for energy and agricultural commodities.
- Real household incomes are under pressure in many economies and financial conditions are tightening, as central banks withdraw monetary policy support in response to broad-based inflation.
- There are also ongoing uncertainties related to COVID, especially in China.
9. Wage Price Index
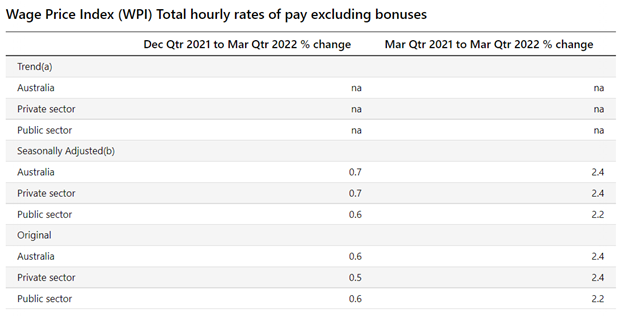
ABS (data published 18 May 2022)
March quarter 2022
- Rose 0.7% this quarter and 2.4% over the year.
- The private sector rose 0.7%.
- Public sector rose 0.6%
Industries
- Quarterly wage growth – largest increase seen in
- Arts and recreation
- Education and training
- Admin and support services
- Annual wage growth – largest increase seen in
- Rental, hiring and real estate services
- Information media and telecommunications
- Manufacturing
States
- Annual change – largest increase seen in
- Tas and ACT
- Quarterly change – largest increase seen in
- NSW, Vic, SA, Tas
If you’d like to discuss your property plans or mortgage strategy, please get in touch with us here.


