1. March index results
CoreLogic – (Data published 1 Apr)
A. National values
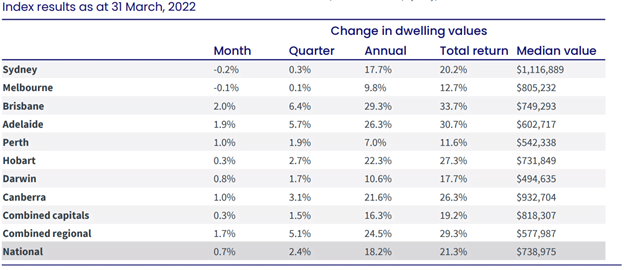
- Australian housing values increased a further 0.7% in March, up from February’s 0.6%
- The uptick in the monthly rate of growth was primarily driven by stronger conditions in Brisbane, Adelaide, Perth and the ACT, along with several regional areas, offsetting a slip in values across Sydney and Melbourne.
- With the softening in market conditions, the national annual growth rate (18.2%) has fallen below the 20% mark for the first time since August last year, after reaching a cyclical high of 22.4% in January 2021.
- 18th consecutive monthly increase in national home values.
- The first quarter of the year has seen Australian dwelling values rise by 2.4%, adding approximately $17,000 to the value of an Australian dwelling.
- A year ago, values were rising at more than double the current pace, up 5.8% over the three months to March 2021 before the quarterly rate of growth peaked at 7.0% over the three months ending May 2021.
- Sydney’s growth rate is showing the most significant slowdown, falling from a peak of 9.3% in the three months to May 2021, to 0.3% in the first quarter of 2022.
- Melbourne’s housing market has seen the quarterly rate of growth slow from 5.8% in April last year to just 0.1% over the past three months.
- Above 20% – Brisbane 29.3%, Adelaide 26.3%, Hobart 22.3%, Canberra 21.6%
- Adelaide overtakes Hobart
- Sydney 17.7%, Darwin 10.6%, Melbourne on 9.8%, and Perth 7.0%
- Sydney no longer above 20% growth
- Darwin overtakes Melbourne
B. Month Highlights
Growth over March
- National – 0.7% remains positive across all capitals except Sydney and Melbourne
- Combined capitals – 0.3% same as last month
- Combined regionals – 1.7% after 1.6% last month
- Brisbane – 2.0% after 1.8% last month
- Adelaide – 1.9% after 21.5% last month
- Canberra – 1.0% after 0.4% last month
- Perth – 1.0% after 0.3% last month
- Darwin – 0.8% after 0.4% last month
- Hobart – 0.3% after 1.2% last month
- Melbourne – negative 0.1% after 0.0% last month
- Sydney – negative 0.2% after negative 0.1% last month
Median values – ALL DWELLINGS
- National – $728,034
- Combined capitals – $808,792
- Combined regional – $564,496
- Capitals –
- Sydney – $1,116,219
- Canberra – $909,379
- Melbourne – $799,756
- Hobart – $724,366
- Brisbane – $722,433
- Adelaide – $593,883
- Perth – $535,335
- Darwin – $495,496
C. Regions
- Regional Australia continues to show some resilience to a slowdown with housing values across the combined regional areas rising at more than three times the pace of the combined capital cities through the March quarter.
- Regional dwelling values increased 5.1% in the three months to March, compared with the 1.5% increase recorded across the combined capital cities.
- The rolling quarterly growth rate in regional dwelling values has consistently held above the 5% mark since February 2021.
- Australian Bureau of Statistics (ABS) regional population growth figures for FY2020-21 help explain the strong housing conditions outside of the capitals.
- The number of people living in regional areas of Australia increased by almost 71,000 residents, while residents living in the capitals fell by approximately 26,000 (mostly due to a sharp drop in Melbourne and, to a lesser extent, Sydney).
2. Rents
CoreLogic – (Data published 1 Apr)
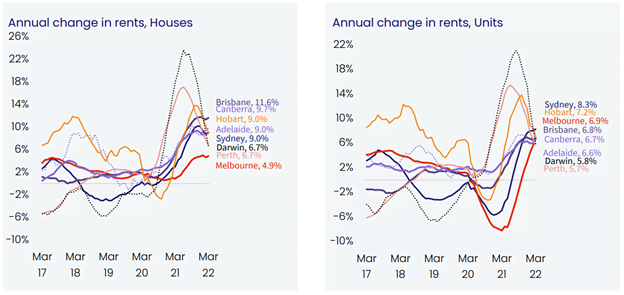
- Rental trends are becoming increasingly diverse across Australia.
- At a macro level, rents are still rising at well above average rates.
- While annual rental growth has eased from a recent peak of 9.4% in November last year to 8.7% over the 12 months ending March 2022, the quarterly pace of growth has rebounded through the first quarter of the year, from 1.9% in Dec 2021 to 2.6% in March 2022.
- The rebound is partly seasonal as rental trends tend to be stronger through the first quarter of the year, but there are other factors at play including stronger conditions across the medium to high density rental sector.
- The rate of growth in unit rents has strengthened to reach a cyclical high of 3.0% in the March quarter, rising at a materially faster pace than house rents (2.4%).
- The stronger rental conditions across the unit sector demonstrates a remarkable turnaround in rental conditions across higher density markets, where rents fell sharply through the first nine months of the pandemic.
- “Through the pandemic to-date, capital city house rents have risen by 13.8% compared with a 3.4% rise in unit values,” Mr Lawless said.
- “The net result is that renting a unit is substantially more affordable than renting a house.
- This affordability advantage, along with a gradual return of overseas migration, employees progressively returning to offices and inner city precincts regaining some vibrancy, are likely key factors pushing unit rents higher,” Mr Lawless said.
- Sydney is now recording the strongest lift in unit rents, up 8.3% over the 12 months to March following a 7.2% peak to trough fall in the first half of the pandemic.
- Similarly, Melbourne unit rents are up 6.9% over the past year after posting an 8.5% peak to trough fall.
- With national rents up 2.6% over the March quarter and housing values rising by a lower 2.4%, gross yields have posted a rare rise in March, up two basis points from a record low of 3.21% in January and February to 3.23%.
- If rents continue to outpace housing values, which is likely if the housing market moves into a downturn, yields will continue to recover.
3. Vacancy rates
SQM (Data published 15 Mar)
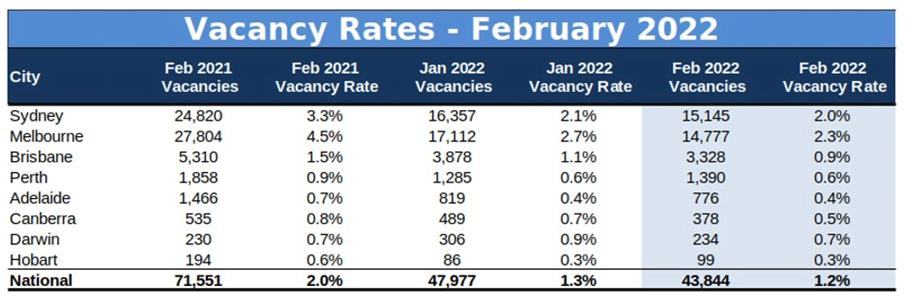
- Vacancy rates have dropped even further to 1.2% nationally in January, for a fresh 16 year low
- Melbourne has the highest vacancy rate of 2.3%, but this has improved from 2.7% in January and 3.2% in December.
- Sydney with second highest vacancy at 2.0%, down from 2.1%
- Then Brisbane 0.9%, dropping slightly from 1.1% in January
- Darwin down to 0.7%, following 0.9% in January, and 1.2% in December.
- Perth – 0.6% – no change since November
- Canberra 0.5% – down from 0.7% in January
- Adelaide dropping to 0.4% – no change from January
- Hobart – holding steady at 0.3% from the previous 2 months
4. Listings
CoreLogic – (Data published 1 Mar)
Total listings
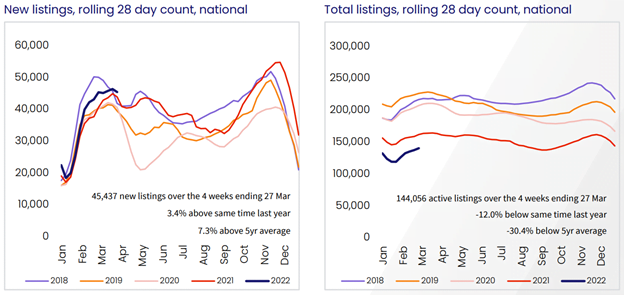
- 8% increase in national listings over March, and down 14.9% over the year.
- Trends in property listings continue to help explain the divergence in housing growth trends.
- Advertised inventory, at a national level, is tracking 30% below the previous five-year average over the four weeks ending March 27.
- Compared with 5 year average
- In Melbourne, total advertised supply was 8% above the previous five-year average towards the end of March
- while the number of homes available to purchase in Sydney had virtually normalised to be 7.5% higher than a year ago and only 2.6% below the five-year average.
- Higher stock levels across these markets can be explained by an above average flow of new listings coming on the market in combination with a drop in buyer demand.
- In contrast, advertised stock levels in Brisbane and Adelaide remain more than 40% below the previous five-year average levels and around 20% to 25% down on a year ago.
- It’s a similar scenario across regional Australia, where total advertised housing stock was 22% below last year’s level and 43% below the previous five-year average.
- Such low inventory levels along with persistently high buyer demand continues to create strong selling conditions in these areas, supporting the upwards pressure on prices.
- Over the year
- Total listings the lowest in Brisbane – down 30.2% over the year, then Adelaide down 24.2%.
- Darwin largest increase in annual listings – up 15.2%
- Sydney and Perth both up on annual listings, 5.5% and 0.5% respectively
- Over the month
- Hobart and Melbourne the biggest monthly change with Hobart increase of 4.9% over March and Melbourne 3.5%
New listings
- Over the year listings are up 0.2% nationally
- Largest increase in Canberra 5.8% and Perth 5.1%
- Hobart 4.9% and Sydney 3.9%
- Melbourne, Brisbane, Adelaide and Darwin in negative territory for annual listings
- New listings increased for every capital over March – Largest increases in:
- Canberra – 16.4%
- Hobart – 14.7%
- Melbourne – 9.3%
Old listings
- Decreased 2% over March, and down 45.9% over the year nationally
- All capital cities (bar Darwin) listings have decreased in the last 12 months – Canberra and Brisbane with the highest decreases of 71.9% and 63.3% respectively
- Over the month:
- Canberra with a drop in old listings of 50%
- Darwin the only capital with increases in old listings over March with 9.6% increase
5. Consumer sentiment – time to buy a dwelling and house price expectations
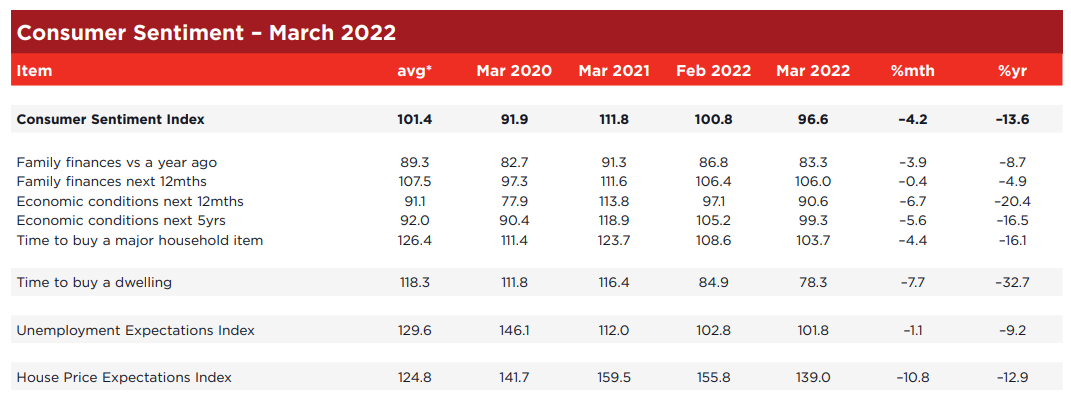
Westpac Melbourne Institute (Data published 9 Mar)
House price expectations index
- Drop to 139 points, after 155.8 in February.
Comments from Westpac Melbourne
- Arguably the most eye-catching aspect of today’s survey is the 10.8% fall in the Westpac Melbourne Institute House Price Expectations Index.
- At 139.0 the Index is still well above 100, meaning that most consumers still expect prices to rise.
- However, that confidence is now starting to erode quite quickly.
- The weakness was across all major states, with NSW (–12.9%) and Western Australia (–14.5%) recording the largest declines.
- Westpac expects national measures of dwelling prices to begin falling in the December quarter following rate increases from the Reserve Bank in August and October.
- From our perspective, it is surprising that we have not seen a sharper fall in the House Price Expectations Index to date – we saw sustained periods of sub-100 reads during the 2018-19 and 2020 correction periods.
- That said, official rate hikes – which we expect to be the key catalyst this time around – are yet to be fully factored into consumers’ house price views.
Time to buy a dwelling index
- Down to 78.3 in March, after 84.9 in February.
- From July 2021 the index has been hovering from the low 80’s to high 90’s.
Comments from Westpac Melbourne
- The ‘time to buy a dwelling’ index fell by 7.7% to 78.3, down 40.6% from its recent peak in November 2020.
- The latest fall was most pronounced in NSW where the state index dropped 13.4% to be 10-15% below the other major states.
- The national index is now at its lowest level since February 2008, during the Global Financial Crisis and well below the 90-95 levels seen in 2017–18, when housing markets were particularly weak.
- We have found housing affordability to be a key driver of this index.
- The combination of a 27% surge in dwelling prices nationally over the last year and a half; rising fixed mortgage rates; and the prospect of higher standard variable rates is clearly weighing heavily on homebuyer sentiment.
6. Lending indicators
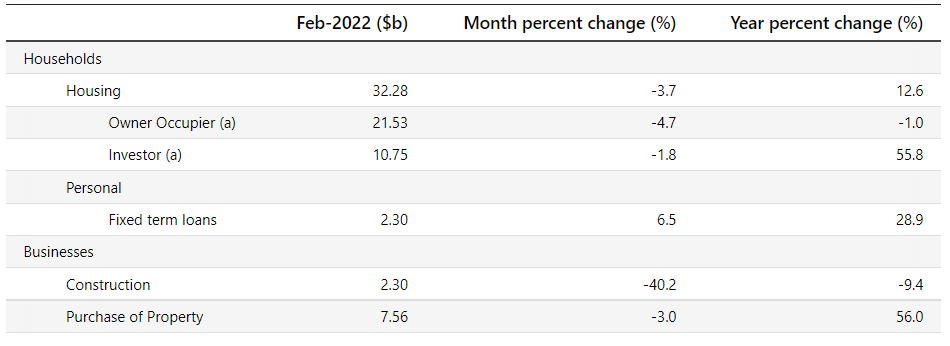
ABS (Data published 1 Apr 2022)
February
- Fell 3.7% for Housing overall
- Fell 3.7% for owner occupier
- Fell 1.8% for investor
- First home buyers decreased 9.7%
New loan commitments
- % of Owner Occ – 66.7% (down from 67.4% in January)
- % of Investors – 33.3% (up from 32.6% in January)
- % of first time buyers (as % of owner occ) – 22.5% (down from 23.7% in January)
Investor levels still below where APRA stepped in at 46% in 2015
7. Unemployment
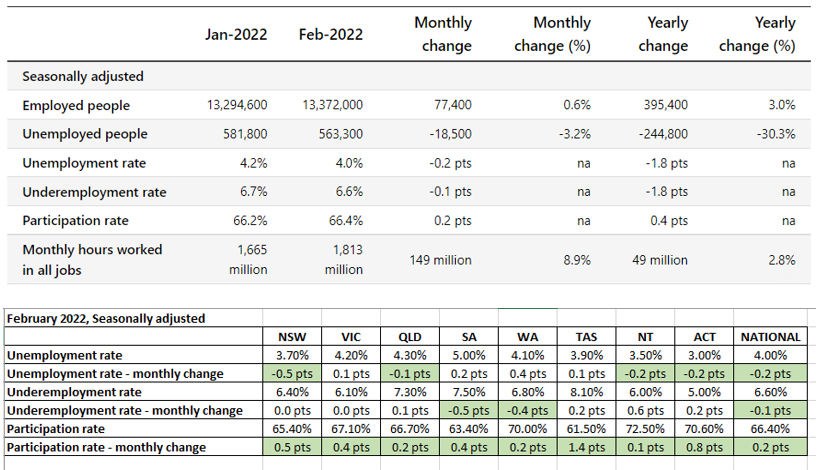
ABS (data published 17 Mar 2022)
February
- Unemployment rate reduced to 4.0% from 4.2% in January
- Reductions in unemployment in NSW, QLD, NT, ACT
- Underemployment rate decreased to 6.6% after 6.7% in January
- Reductions in SA, WA
- Participation rate slight increase to 66.4% after 66.2% in January
- Increases in ALL states
8. RBA announcement
At its meeting today, the Board decided to:
- maintain the cash rate target at 10 basis points and
- the interest rate on Exchange Settlement balances at zero per cent.
RBA minutes
- Inflation
- Inflation has increased sharply in many parts of the world.
- Ongoing supply-side problems, Russia’s invasion of Ukraine and strong demand as economies recover from the pandemic are all contributing to the upward pressure on prices.
- In response, bond yields have risen and expectations of future policy interest rates have increased.
- The Australian economy remains resilient and spending is picking up following the Omicron setback.
- Household and business balance sheets are in generally good shape, an upswing in business investment is underway and there is a large pipeline of construction work to be completed.
- Macroeconomic policy settings also remain supportive of growth and national income is being boosted by higher commodity prices.
- At the same time, rising prices are putting pressure on household budgets and the floods are causing hardship for many communities.
- Inflation has increased in Australia, but it remains lower than in many other countries; in underlying terms, inflation is 2.6 per cent and in headline terms it is 3.5 per cent.
- Higher prices for petrol and other commodities will result in a further lift in inflation over coming quarters, with an updated set of forecasts to be published in May.
- The main sources of uncertainty relate to the speed of resolution of the various supply-side issues, developments in global energy markets and the evolution of overall labour costs.
- Employment
- The strength of the Australian economy is evident in the labour market, with the unemployment rate falling further to 4 per cent in February.
- Underemployment is also at its lowest level in many years.
- Job vacancies and job ads are at high levels and point to continuing strong growth in employment over the months ahead.
- The RBA’s central forecast is for the unemployment rate to fall to below 4 per cent this year and to remain below 4 per cent next year.
- Wages
- Wages growth has picked up, but, at the aggregate level, is only around the relatively low rates prevailing before the pandemic.
- There are, however, some areas where larger wage increases are occurring.
- Given the tightness of the labour market, a further pick-up in aggregate wages growth and broader measures of labour costs is in prospect.
- This pick-up is still expected to be only gradual, although there is uncertainty about the behaviour of labour costs at historically low levels of unemployment.
- Financial conditions
- Financial conditions in Australia continue to be highly accommodative.
- Interest rates remain at a very low level, although fixed mortgage rates for new loans have risen recently.
- The Australian dollar exchange rate has appreciated due to the higher commodity prices and, in TWI terms, is around the level of a year ago.
- Housing prices have risen strongly over the past year, although some housing markets have eased recently.
- With interest rates at historically low levels, it is important that lending standards are maintained and that borrowers have adequate buffers.
- Hinting at interest rates
- The Board’s policies during the pandemic have supported progress towards the objectives of full employment and inflation consistent with the target.
- The Board has wanted to see actual evidence that inflation is sustainably within the 2 to 3 per cent target range before it increases interest rates.
- Inflation has picked up and a further increase is expected, but growth in labour costs has been below rates that are likely to be consistent with inflation being sustainably at target.
- Over coming months, important additional evidence will be available to the Board on both inflation and the evolution of labour costs.
- The Board will assess this and other incoming information as its sets policy to support full employment in Australia and inflation outcomes consistent with the target.
If you’d like to discuss your property plans or mortgage strategy, please get in touch with us here.


