1. Home Value Index Results
CoreLogic – (Data published 1 July 22)
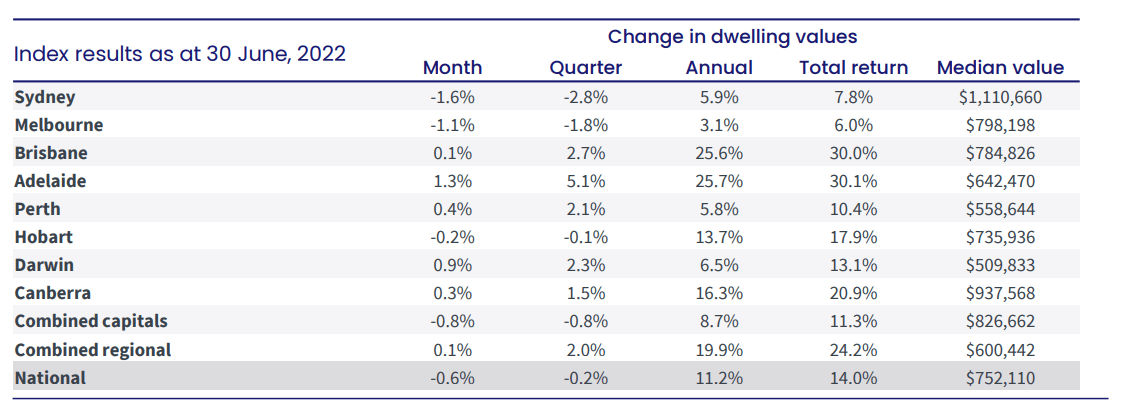
Growth over June
- National: -0.60%
- Combined capitals: -0.8%
- Combined regionals: 0.1%
- Adelaide: 1.3% after 1.8% last month
- Darwin: 0.9% after 0.5% last month
- Perth: 0.4% after 0.6% last month
- Canberra: 0.3% after 0.1% last month
- Brisbane: 0.1% after 0.8% last month
- Hobart: -0.2% after 0.3% last month
- Melbourne: -1.1% after -0.7% last month
- Sydney: -1.6% after -1.0% last month (LARGEST FALL IN HOUSE PRICES SINCE 1989)
High quality property is still having competition!
Annual growth trends
- Annual change – Above 20% – Adelaide 25.7%, Brisbane 25.6%
- Annual change – Below 20% – Combined regional 19.9%, Canberra 16.3%, Hobart 13.7%, Darwin 6.5%, Sydney 5.9%, Perth 5.8% and Melbourne 3.1%
Month Highlights
- Second consecutive month of value declines – negative 0.6% in June and -0.2% over June quarter
- Every capital city and broad rest of state region is now well past their peak rate of growth as trend rates eased across the remaining markets.
- Australia’s third largest city, Brisbane, has seen growth in housing values flatten out to just 0.1% in June
- Adelaide remains the only capital still recording a monthly growth rate higher than 1.0% (1.3%).
- Growth in Perth’s housing values, which were temporarily showing a second wind as state borders reopened, are again losing steam with values up 0.4% in June.
- Housing value growth has been easing since moving through a peak in March last year
- Why – Early drivers of the slowdown included:
- Rising fixed term mortgage rates
- An expiry of fiscal support
- A trend towards lower consumer sentiment
- Affordability challenges and tighter credit conditions
- Surging inflation, and
- A rapidly rising cash rate have added further momentum to the downwards trend.
Regions
- The combined regionals index remained in positive growth territory in June, albeit slightly, rising 0.1%, reducing quarterly growth from a peak of 6.6% in April last year, to 2.0% over the three months to June.
- In contrast, the combined capital cities index was down -0.8% over the June quarter, reducing from a peak of 7.1% over the three months to May last year.
Houses vs Units
- Unit markets are holding their value a little better than houses across the largest capitals.
- Sydney recorded a -3.0% drop in houses values through the June quarter compared with a -2.1% fall in unit values.
- Melbourne also showed a smaller quarterly decline in units relative to houses at -0.5% and -2.4% respectively.
- “The stronger performance across the unit sector comes after house values consistently outperformed units through the upswing,” Mr Lawless said.
- “Since the onset of the pandemic in March 2020, capital city unit values have risen 9.8% compared to 24.7% for houses, resulting in better affordability across the medium to high density sector.”
2. Rents
CoreLogic – (Data published 1 July 22)
Nationally
- Rental markets remain extremely tight around the country, with rents now consistently rising at a faster rate than housing values.
- Nationally, CoreLogic’s Hedonic Rental Index increased 0.9% in June, after 1.0% in May,
- Taking the annual growth rate to 9.5%
- This is the highest annual growth rate since December 2007 when record levels of overseas migration pushed rental demand higher.
What has caused the rental surge:
- Higher prices
- Incomes have outstripped inflation until recently (new phenomenon)
- We learnt from the Census that we have had a reduction in the average household size which means we need more houses for the same number of people. EG that less people on average live in houses
- From the Census we learn the number of owner occupiers has increased as a % from 5 years ago, the downside is that there are less rental properties.
- Overall investment activity has reduced since 2015 to 2021.
- People moving back into rentals
Is the canary in the coal mine that will most likely drive the levelling out and rebound in property prices.
What will signal the bottoming out of the price growth slow down and any retraction –
- Low vacancy rates (still reducing)
- Overseas migration increasing (already happening) opening of international borders has already started
- Listing numbers continuing to fall
- Along with rates staying on hold for a month OR multiple months.
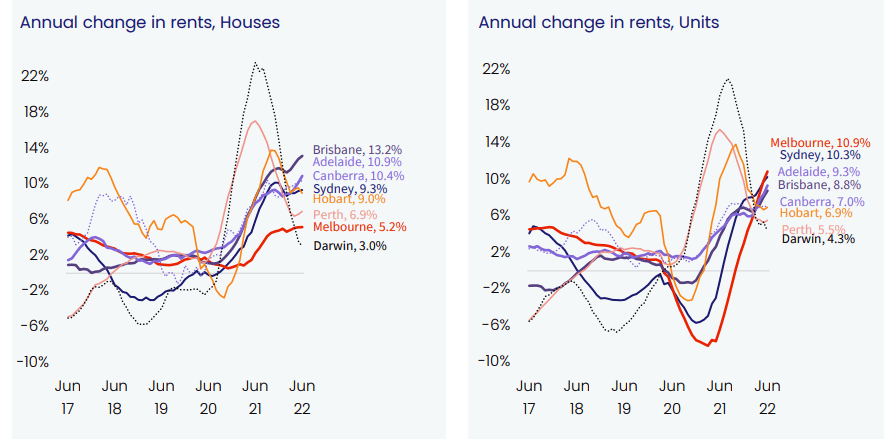
Houses vs units
- The trend in unit rents has turned around remarkably over the past year, after falling sharply in some cities early in the pandemic.
- Sydney and Melbourne unit rents are now rising substantially faster than house rents, with tenants taking advantage of more affordable medium to high density rental options.
Rental yields
- At the national level, rents have been rising faster than housing values for five months now, placing renewed upwards pressure on yields.
- After bottoming out at a record low of 3.21% in the first two months of 2022, the average gross yield has increased to 3.33%.
- With rental markets expected to remain tight, it’s likely rents will continue to outpace growth in housing values, driving a rapid recovery in rental yields.
3. Vacancy rates
SQM (Data published 15 June)
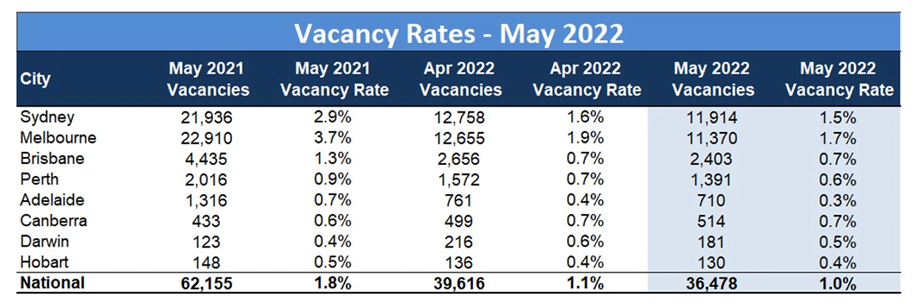
May – Reduced again after a slight increase last month
- National residential property rental vacancy rates back to 1.0% in May, after rising slightly to 1.1% in April, from 1.0% in March.
- Melbourne has the highest vacancy rate of 1.7% – down from 1.9%
- Melbourne CBD –2.9% – no change
- Sydney with second highest vacancy at 1.5% – down from 1.6%
- Sydney CBD – 3.5% – no change
- Then Brisbane, Canberra – 0.7% – no change
- Perth – 0.6% – down from 0.7%
- Darwin – 0.5% – down from 0.6%
- Hobart – 0.4% – down from 0.5%
- Adelaide – 0.3% – down from 0.4%
4. Listings
CoreLogic – (Data published 1 July 22)
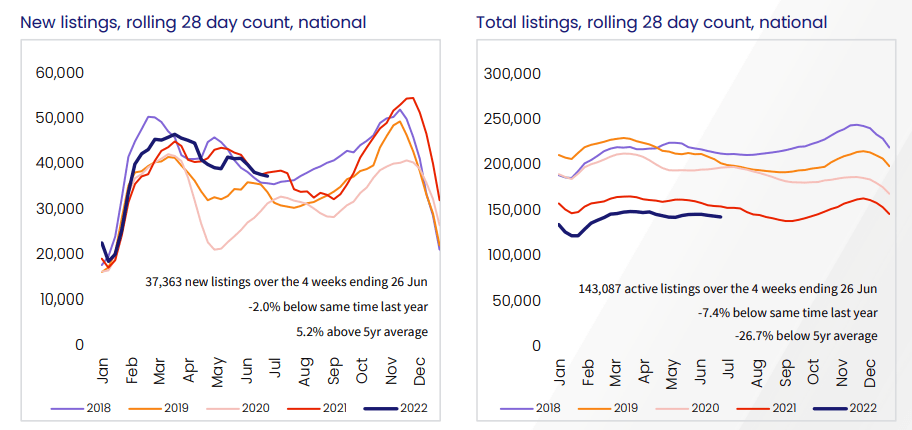
TOTAL listings
- National advertised stock levels remain -7.4% lower relative to 2021.
- In Sydney and Melbourne, where housing conditions are the weakest, total advertised supply is now 7-8% above the levels recorded a year ago and well above the five-year average.
- Hobart has seen advertised stock levels jump 48.4% higher relative to last year and inventory is 20.7% higher in Canberra.
- In Adelaide, where housing conditions remain quite strong, advertised stock levels are still -16.9% lower than last year and almost -40% below the five-year average.
- Brisbane (-14.9%) and Perth (-16.2%) are also showing low advertised stock levels relative to this time last year.
- Mr Lawless said the rise in advertised supply across some markets is mostly due to a slowdown in the rate of absorption.
- Estimated transactions in Sydney throughout the June quarter were -36.7% lower than a year ago while Melbourne is down -18.3%.
- At the same time, the flow of new listings added to the market is falling as selling conditions becoming more challenging and listings move into a seasonal lull.
- “We aren’t seeing any signs of panicked selling as housing conditions cool, in fact the trend is the opposite, with the flow of new listings to the market slowing.”
- CoreLogic estimates home sales nationally through the June quarter were -15.9% lower than a year ago, but are still holding 13.0% above the previous five-year average.
- Tougher selling conditions are evident in weekly auction results, where the combined capitals clearance rate has held below 60% since the last week of May, longer selling times and higher levels of vendor discounting rates across private treaty sales.
NEW listings
- Over the year listings are down 2.1% nationally
- Largest decrease in Canberra 14.9%, Sydney 13.9%
- Hobart increase of 38.5%
- New listings decreased for most capitals in May
- Melbourne 14.4%
- Sydney 9.4%
- Adelaide 8.4%
- Perth 7.5%
- Canberra 4.8%
- Brisbane 0.2%
- Overall stock on market fell for the month largely due to the decline in new listings.
- The fall in new listings was a result of reduced vendor confidence in the strength of the housing market as well as seasonal factors whereby the winter period normally records a decline in residential property sales activity, particularly for Sydney and Melbourne.
OLD listings
- Increased 1.6% in June, and down 31.3% over the year nationally
- All capital cities (bar Melbourne) listings have decreased in the last 12 months – Canberra 56.5%, Adelaide 54.2%, Brisbane 53.4% and Hobart 44.5% with the highest decreases
- Over the month: Canberra 14.6% increase in old listings and Melbourne 3.8%
- This reveals the slowdown in the housing market driven by lower buyer demand.
- Going forward we expect July to record similar trends of lacklustre activity and more rises in older listings.
5. Consumer sentiment – time to buy a dwelling and house price expectations
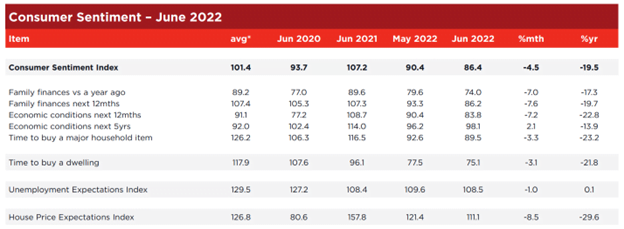
Westpac Melbourne Institute (Data published 15 June 22)
Consumer Sentiment has dropped to 86.4 from 90.4
A. Time to buy a dwelling index
- Drop to 75.1 points, after 77.5 in May
- From July 2021 the index has been hovering from the low 80’s to high 90’s.
- a new post-GFC low.
- The index reflects deteriorating affordability which had been due to rising prices but is now being affected by actual and expected rises in interest rates.
- A deep chasm has opened between males and females on this topic, with index reads of 85.8 (up 1.1%) for males and 64.7 (down 8.6%) for females.
B. House price expectations index
- Drop to 111.1 points, after 121.4 in May
- I suspect seeing this move through 100 could be around a turning point in the market.
- Similar as we see the Time to buy a dwelling index start to rise will also send another signal.
- In NSW the Index fell by 11.2% to 103.8 while in Victoria it fell by 9.9% to 101.50.
- In contrast, optimism still abounds in Queensland where the state index rose 3.1% 124.5.
6. Lending indicators
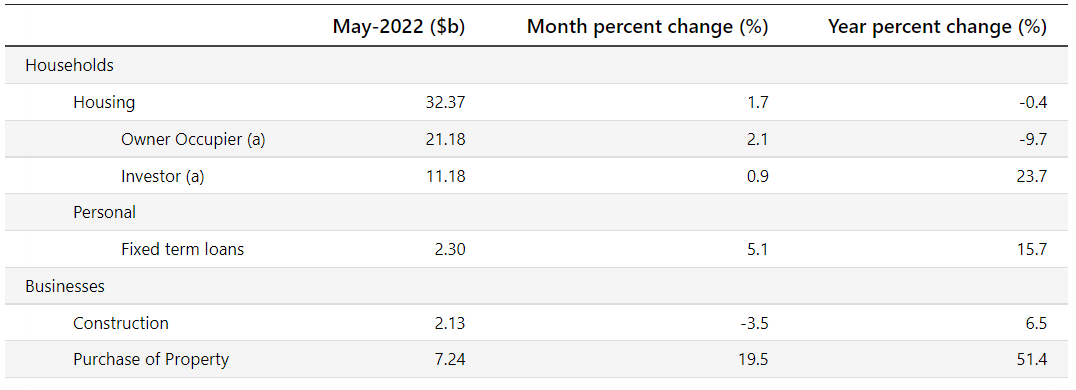
ABS (Data published 4 July 2022)
May
- Rose 1.7% for Housing overall
- Rose 2.1% for owner occupier
- Rose 0.9% for investor
- First home buyers rose 3.4%
New loan commitments – very little change from previous month
- % of Owner Occ – 65.41% (up from 64.24% % in April)
- % of Investors – 34.59% (down from 35.76% in April)
- % of first time buyers (as % of owner occ) – 23.51% (on par 23.75% in April)
Investor levels still below where APRA stepped in at 46% in 2015
7. Unemployment
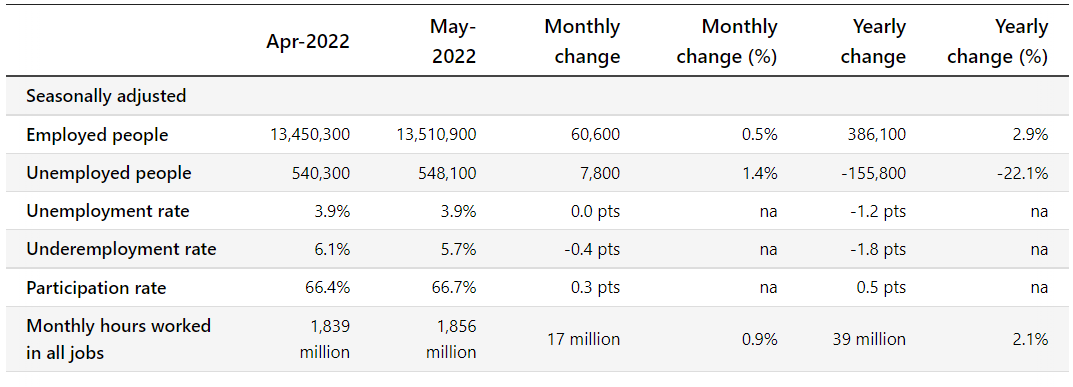
ABS (data published 16 June 2022)
May
- Unemployment rate remained 3.9%
- Reductions in unemployment in VIC, QLD
- Underemployment rate decreased to 5.7% after 6.1% in April
- Reductions in NSW, VIC, SA, WA, TAS, NT, ACT
- Participation rate increased to 66.7% after 66.3% in April
- Increases in NSW, QLD, SA, WA, TAS, NT
8. RBA announcement
At its meeting, the Board decided to:
- Increase the cash rate target by 50 basis points to 1.35 per cent.
- It also increased the interest rate on Exchange Settlement balances by 50 basis points to 1.25 per cent.
Australia’s economy dominated by variable rates
- Australia’s economy is highly sensitive to rate increases
- Dominated more than any other by a preponderance of variable-rate, rather than fixed-rate,
- A prudent policymaker would be gradually lifting the cash rate in standard, 25-basis-point increments every month and “nowcasting” the real-time data flows to assess the impact.
- That might get you to 2.5 per cent, or you might have to stop well short of that mark.
Historical rate increases
- If RBA raises rates by 50bps next month, rates will have risen by 175 bps in a period of three months
- The last time this happened was in 1994 when the level of the RBA’s cash rate was about five times higher than its starting point this year (the proportional change in interest repayments was, therefore, a lot less).
- And in 1994, the household debt-to-income ratio was only 44 per cent of its current level.
- Put simply, Australians were a lot less sensitive to interest rate changes 28 years ago.
Inflation
- Inflation is forecast to peak later this year and then decline back towards the 2–3per cent range next year.
- As global supply-side problems continue to ease and commodity prices stabilise, even if at a high level, inflation is expected to moderate.
- Higher interest rates will also help establish a more sustainable balance between the demand for and the supply of goods and services.
If you’d like to discuss your property plans or mortgage strategy, please get in touch with us here.


