The Property Planner’s Monthly Market Update – January 2022
1. Jan index results
CoreLogic (Data published 1 Feb)
A. National values
- Australian housing values increased a further 1.10% in January, after 1.00% in December, 1.3% in November, 1.49% in October, 1.51% in September and 1.5% in August, and 1.6% in July.
- The annual change in national housing values reached a new cyclical high in January, with Australian dwellings up 22.4% over the year. This is the highest annual rate of growth since June 1989.
- In approximate dollar value terms, the typical Australian home is now worth $131,236 more than it was a year ago
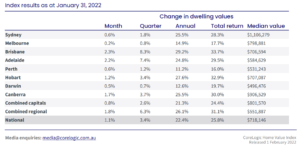
- Above 20% – Brisbane 29.2%, Hobart 27.6%, Sydney 25.5%, Canberra 25.5% and Adelaide 24.8%
- Brisbane overtakes Hobart for the top spot
- Melbourne on 14.9%, Darwin 12.6%, and Perth 11.2%
According to CoreLogic’s research director, Tim Lawless:
- As the volume of home sales moves out of seasonal lows, we should get a firmer reading on how 2022 is shaping up.
- The early indication is that housing markets are starting 2022 with a similar trend to what we saw through late last year.
- Values are still broadly rising, but nowhere near as fast as they were in early 2021.
- A softening in growth conditions has been influenced by
- less government stimulus,
- worsening affordability,
- rising fixed-term mortgage rates and,
- more recently, a slight tightening in credit conditions, and a surge in new listings through the final quarter of last year
B. Month Highlights
Growth over January
- National – 1.1%
- remains positive across all capitals
- Combined capitals – 0.8% after 0.6% last month
- Combined regionals – 1.8% after 2.2% last month
- Brisbane – 2.3% after 2.9% last month
- Adelaide – 2.2% after 2.6% last month
- Canberra – 1.7% after 0.9% last month
- Hobart – 1.2% after 1% last month
- Perth – 0.6% after 0.4% last month
- Sydney – 0.6% after 0.3% last month
- Darwin – 0.5% after 0.6% last month
- Melbourne – 0.2% after negative 0.1% last month
Median values
- National – $718,146
- Combined capitals – $801,570
- Combined regional – $551,887
- Capitals –
- Sydney – $1,106,279
- Canberra – $906,529
- Melbourne – $798,881
- Hobart – $707,087
- Brisbane – $706,594
- Adelaide – $584,629
- Perth – $531,243
- Darwin – $496,476
C. House V Units
- Houses are still recording a higher rate of growth than units.
- Nationally house values were up 1.3% in January compared with a 0.3% rise in unit values; a trend that has been apparent throughout the pandemic.
- Three of the eight capital cities are now recording a median house value over the $1 million dollar mark.
- Melbourne’s median house value surpassed $1 million for the first time in January,
- Canberra – second month in a row Canberra’s median house value passed $1million.
- In Sydney, the median house value climbed to just under $1.39 million.
- The difference between the national median house and unit value reached a new record high of 28.3% in January.
- This may see demand gradually deflect towards the more affordable medium-to-high density sector of the market
2. Rents
CoreLogic (Data published 1 Feb)
CoreLogic (Data published 1 Feb)
- The quarterly pace of growth in Australian rents has been easing since moving through a peak in March last year.
- At that time, the national rental index was up 3.2% in the March quarter, reducing to a quarterly growth rate of 2.0% over the three months ending January 2022.
- In annual terms, national rents are up 9.0%, which is slightly down on the recent peak annual rate recorded in November last year at 9.4%.
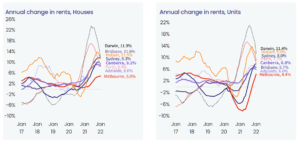
- The annual trend highlights a broad slowing in rental growth conditions. This is most notable in Darwin and Perth.
- Annual growth in Perth rents peaked at 16.9% in June 2021, slowing to 8.8% in January.
- In Darwin, rental growth peaked at 22.3% in the year to August 2021 and was 11.7% in January.
- The slowdown in rental appreciation may reflect some disruption to rental demand due to closed borders in WA, along with renewed affordability pressures following the surge in rents.
- Rental trends in Melbourne and Sydney have shown the opposite trend, especially in the unit sector.
- Rental demand has increased as house rents become more unaffordable.
- Brisbane and Canberra are now recording the fastest rise in rents.
- Over the three months ending January, dwelling rents in Brisbane and the ACT were both up 2.3%, while the markets where rents were previously rising the fastest, Darwin and Perth, recorded the slowest pace of rental growth at 0.2% and 1.4% over the rolling quarter.
- The stronger rental growth in Brisbane and Canberra reflects an imbalance between rental supply and demand, especially for houses, where rental growth has been higher than across units.
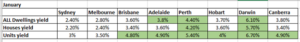
- Gross rental yields fell to new record lows in January.
- The gross rental yield at a national level fell to 3.21%, down from 3.69% a year ago.
- Sydney (2.4%) and Melbourne (2.8%) remain the only capitals where gross yields are averaging sub-3%.
3. Listings
CoreLogic – (Data published 1 Feb)
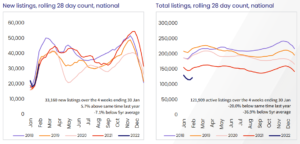
- Advertised inventory finished the year 24.7% below the five-year average.
- Nationally, the number of new listings added to the Australian housing market through December was 21.4% above the five-year average, demonstrating strong vendor confidence amidst quick selling times and high auction clearance rates.
- This confidence has not been universal, with listings trends varying from city to city.
- Melbourne was the only city to finish the year with inventory levels above the five-year average, while Sydney listings were only 3.9% below average.
- Brisbane and Adelaide’s advertised supply remains around 35% below the five-year average.
- “The number of homes available to purchase has been a key factor underlying the trend in housing values. Cities where advertised stock levels are above average or close to normal, such as Melbourne and Sydney, have shown a more obvious slow down relative to cities with persistently low advertised supply, like Brisbane and Adelaide,” Mr Lawless said.
- While stock levels have generally been low, the total number of home sales in 2021 was approximately 40% above the decade average.
- CoreLogic estimates there were approximately 653,000 house and unit settlements over the calendar year, the highest number of annual sales on record.
- “Such a significant mismatch between available housing supply and the level of demand is a fundamental reason why housing prices have risen so sharply over the year.” Tim Lawless, CoreLogic
Total listings
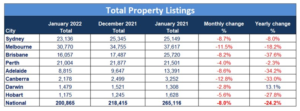
SQM (Data published 1 Feb 2022)
- 8% decrease in national listings over January, and down 24.2% over the year
- Total listings the lowest in Brisbane – down 37.6% over the year, then Adelaide 34.2% and Canberra down 33%
- Darwin the only capital with increase in annual listings – up 13.1%
- Canberra and Melbourne the biggest monthly change with Canberra down 12.8% over January and Melbourne 11.5%
New Listings
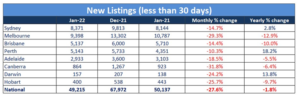
SQM (Data published 1 Feb 2022)
- Over the year listings are down 1.8% nationally
- Largest increase in Perth of 18.2%, then Darwin 13.8%, then Sydney 2.8%.
- All other capitals are in the negative for yearly change.
- New listings decreased for every capital over January – as expected with the holiday season and return to work.
Old listings
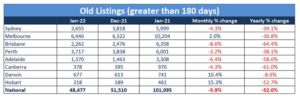
SQM (Data published 1 Feb 2022)
- Decreased 5.9% over January, and down 52% over the year nationally
- All capital cities listings have decreased in the last 12 months –Brisbane and Canberra the highest with decreases of 64.4% and 61% respectively
- Hobart, Darwin, and Melbourne the only capitals with increases in listings over January
- Hobart – 15.3%
- Darwin – 10.4%
- Melbourne – 2%
4. Consumer sentiment – time to buy a dwelling and house price expectations
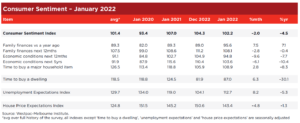
Westpac Melbourne Institute (Data published 19 Jan)
Time to buy a dwelling index
- Up to 87.0 after dropping to 81.9 points in December, November, 83.3 points in October, 96.7 points in September, 88.9 in August, and July 96.9 points.
Comments from Westpac Melbourne
- The ‘time to buy a dwelling’ index lifted 6.3% but is still down 34% from its November 2020 peak, the latest month only partially reversing a 10.2% decline in December.
- This measure is particularly sensitive to shifts in affordability.
- The January gain may be an early sign that an actual and expected moderation in house prices is starting to see buyer sentiment stabilize.
- However, any stabilization is likely to be at relatively low levels, particularly given growing consumer expectations of a rise in mortgage interest rates.
House price expectations index
- Down to 143.4 after 150.6 in December
- This is the first time since January 2021 that the index is below 150 points
Comments from Westpac Melbourne
- Consumers are becoming less bullish on the outlook for house prices.
- The Westpac Melbourne Institute House Price Expectations Index fell 4.8% to 143.4 in January, its lowest level since November 2020.
- That said, most Australians still expect prices to rise over the next year rather than fall.
- Expectations deteriorated in all the major eastern states – the index was down:
- 2.3% in NSW
- 10.8% in Victoria
- 8.5% in Queensland
- But posted a solid 12.6% gain in Western Australia.
- Interestingly, consumers who own investment properties reported a significantly larger 12% decline in price expectations and are considerably more downbeat than owner-occupiers.
5. Lending indicators
ABS (data published 1 Feb)
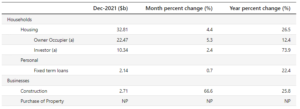
December
- Rose 4.4% for Housing overall
- Increased 5.3% for owner-occupier
- Increased 2.4% for investor
- First home buyers increased 5.3% over December
New loan commitments
- % of Owner Occ – 68.5% (up from 67.9% in November)
- % of Investors – 31.5%(down from 32.1% in November)
- % of first-time buyers (as % of owner occ) – 25.2%
Investor levels still below where APRA stepped in at 46% in 2015
6. Unemployment
ABS (data published 20 Jan)
ABS (data published 20 Jan)
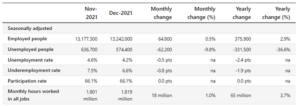
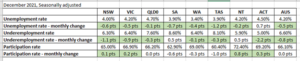
- Unemployment rate decreased to 4.2% in December, after 4.6%, in November, and a spike to 5.2% in October.
- All states bar ACT saw a reduction in unemployment.
- Underemployment rate decreased to 6.6% after 7.5% in November
- ACT leading the reduction by 2.2 points, then VIC 1.1 points
- Participation rate remained the same at 66.1%
- Participation rate increasing slightly for NT, ACT, VIC, NSW
7. RBA announcement
At its meeting today, the Board decided to:
- maintain the cash rate target at 10 basis points and the interest rate on Exchange Settlement balances at zero percent.
- cease further purchases under the bond purchase program, with the final purchases to take place on 10 February.
RBA minutes
- Inflation
- Inflation has picked up more quickly than the RBA had expected, but remains lower than in many other countries.
- The headline CPI inflation rate is 3.5 percent and is being affected by higher petrol prices, higher prices for newly constructed homes, and disruptions to global supply chains.
- In underlying terms, inflation is 2.6 percent.
- The central forecast is for underlying inflation to increase further in coming quarters to around 3¼ percent, before declining to around 2¾ percent over 2023 as the supply-side problems are resolved and consumption patterns normalize.
- One source of uncertainty is the persistence of the disruptions to supply chains and distribution networks and their ongoing effects on prices.
- It is also uncertain how consumption patterns will evolve and how this will affect the balance of supply and demand, and hence prices.
- Bond yields
- The decision to end purchases under the bond purchase program follows a review of the actions of other central banks, the functioning of Australia’s bond market, and the progress towards the goals of full employment and inflation consistent with the target.
- Many other central banks have ended, or will soon end, their bond purchase programs.
- More importantly, faster-than-expected progress has been made towards the RBA’s goals and further progress is likely.
- In these circumstances, the Board judged that now was the right time to end the bond purchase program.
- Since the start of the pandemic, the RBA’s balance sheet has more than tripled to around $640 billion, with this expansion providing continuing support to the economy.
- The Board will consider the issue of the reinvestment of the proceeds of future bond maturities at its meeting in May.
- Cash rate
- The Board is committed to maintaining highly supportive monetary conditions to achieve its objectives of a return to full employment in Australia and inflation consistent with the target.
- Ceasing purchases under the bond purchase program does not imply a near-term increase in interest rates.
- As the Board has stated previously, it will not increase the cash rate until actual inflation is sustainably within the 2 to 3 percent target range.
- While inflation has picked up, it is too early to conclude that it is sustainably within the target band.
- There are uncertainties about how persistent the pick-up in inflation will be as supply-side problems are resolved.
- Wages growth also remains modest and it is likely to be some time yet before aggregate wages growth is at a rate consistent with inflation being sustainably at target.
- The Board is prepared to be patient as it monitors how the various factors affecting inflation in Australia evolve.
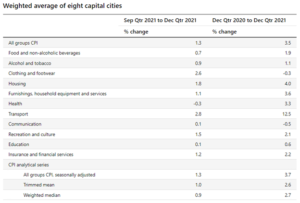
8. CPI
ABS (data published 25 Jan)
ABS (data published 25 Jan)
- December quarter – 1.3% increase
- Annual – 3.5%
- New dwelling prices are up 7.5% over the year – shortages of building materials and labour have contributed to two consecutive quarters of the largest rise in new dwelling prices since September 2000, following the introduction of GST. In combination with fewer payments of Government construction grants.
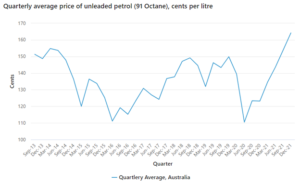
- Automotive fuel prices rose for the sixth consecutive quarter, resulting in the strongest annual rise since 1990.
- Trimmed mean annual inflation, which excludes large price rises and falls, increased to 2.6 percent, the highest since June 2014.
If you’d like to discuss your property plans or mortgage strategy, please get in touch with us here.


