1. Feb index results
CoreLogic – (Data published 1 Mar)
A. National values
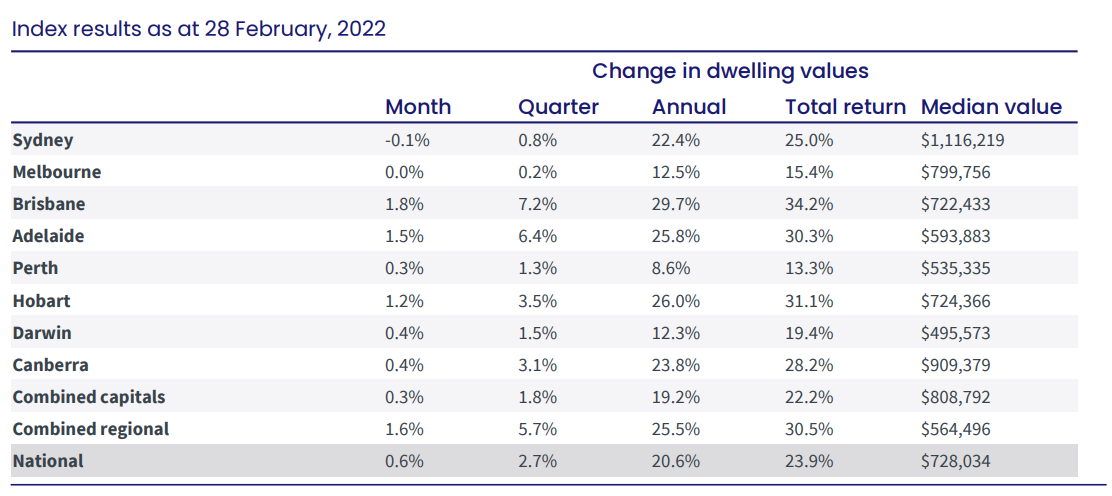
- Australian housing values increased a further 0.6% in February, after 1.10% in January, 1.00% in December, 1.3% in November, 1.49% in October, 1.51% in September and 1.5% in August and 1.6% in July.
- 17th consecutive monthly increase in national home values
- While housing values are generally rising, the pace of growth in the national index has trended downwards since April last year.
- February’s growth of 0.6% marks the lowest monthly growth reading since October 2020 and is down from 1.1% in January and a cyclical peak of 2.8% in March 2021.
- Above 20% – Brisbane 29.7%, Hobart 26.0%, Adelaide 25.8%, Canberra 23.8% and Sydney 22.4%
- Adelaide and Canberra overtake Sydney
- Adelaide overtakes Canberra
- Melbourne on 12.5%, Darwin 12.3%, and Perth 8.6%
According to CoreLogic’s research director, Tim Lawless:
- “Sydney and Melbourne have shown the sharpest slowdown, with Sydney (-0.1%) posting the first decline in housing values since September 2020, while Melbourne housing values (0.0%) were unchanged over the month, following similar results in December (- 0.1%) and January (+0.2%),”
- “Conditions are easing less noticeably across the smaller capitals, especially Brisbane, Adelaide and Hobart, where housing values rose by more than 1% in February.
- Similarly, regional markets have been somewhat insulated to slowing growth conditions, with five of the six rest-of-state regions continuing to record monthly gains in excess of 1.2%.”
- The stronger housing market conditions in Brisbane and Adelaide can be seen in the quarterly growth figures, with Brisbane housing values rising 7.2% over the past three months to February, while Adelaide is up 6.4% over the same period.
- At the other end of the capital city growth spectrum, Melbourne values are 0.2% higher over the past three months while Sydney values have risen by 0.8%
- With the trend in housing values losing pace over the past 11 months, the annual growth trend turned in February.
- Nationally, home values were 20.6% higher over the past 12 months, down from what is likely to be the peak rate of annual growth recorded at 22.4% last month.
B. Month Highlights
Growth over January
- National – 0.6% – remains positive across all capitals except Sydney
- Combined capitals – 0.3% after 0.8% last month
- Combined regionals – 1.6% after 1.8% last month
- Brisbane – 1.8% after 2.3% last month
- Adelaide – 1.5% after 2.2% last month
- Hobart – 1.2% after 1.2% last month
- Canberra – 0.4% after 1.7% last month
- Darwin – 0.4% after 0.5% last month
- Perth – 0.3% after 0.6% last month
- Melbourne – 0.0% after 0.2% last month
- Sydney – negative 0.1% after 0.6% last month
Median values
- National – $718,146
- Combined capitals – $801,570
- Combined regional – $551,887
- Capitals –
- Sydney – $1,106,279
- Canberra – $906,529
- Melbourne – $798,881
- Hobart – $707,087
- Brisbane – $706,594
- Adelaide – $584,629
- Perth – $531,243
- Darwin – $496,476
2. Rents
CoreLogic – (Data published 1 Mar)
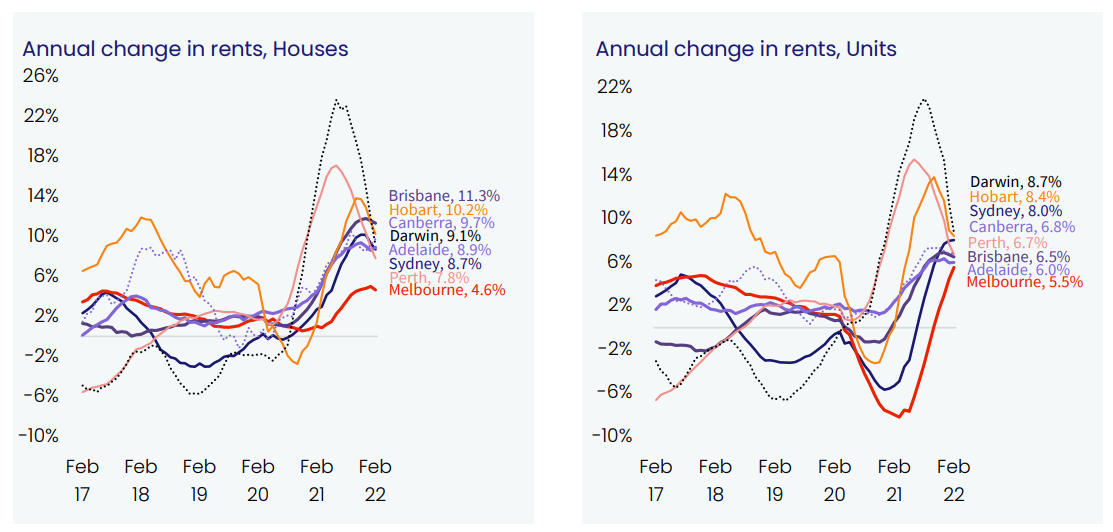
- The pace of rental growth has shown a subtle rebound over the past two months, which can partially be attributed to the seasonal strength in rental markets through the first quarter of the year.
- Nationally, CoreLogic’s rental value index, which utilises a hedonic regression methodology similar to the HVI, was up 0.8% in February, holding firm from January (0.8%) and up from the 0.6% growth recorded in December.
- The February rise in rents was focused within the unit market with the national unit rental index up 0.9% over the month and 2.4% higher over the rolling quarter compared to +0.7% and 2.0% for houses respectfully.
- According to Mr Lawless, this stronger trend in unit rents is most visible in Sydney and Melbourne.
- “Anecdotally, demand for unit rentals in these cities has been bolstered by a combination of –
- worsening rental affordability
- deflecting more demand towards the higher density sector, where rents tend to be lower,
- and demand starting to return from overseas arrivals,” he said.
- With the pace of growth in housing values softening while rental growth holds reasonably firm, the gross yield profile has finally stabilised at 3.2%, the lowest rate on record.
- Sydney (2.4%) and Melbourne (2.8%), which have the lowest yield profiles, recorded a slight strengthening in gross yields this month, as rental growth nudges higher than growth in housing values.
- According to Mr Lawless, we could be seeing rental yields moving through the bottom of their cycle.
- “After several years of yield compression where gross rental yields reached historic lows across most of Australia’s capital cities, we are finally seeing early evidence of yield repair.
- If rents continue to rise faster than housing values, which is a strong possibility in Sydney and Melbourne, yields will continue to improve.
- “Cities such as Brisbane and Adelaide, where housing values are still consistently rising faster than rents, are likely to see yields compress to new record lows.
- Despite the downwards trend, yields in these cities remain well above Sydney and Melbourne levels,” Mr Lawless said.
3. Vacancy rates
SQM- (Data published 15 Feb)
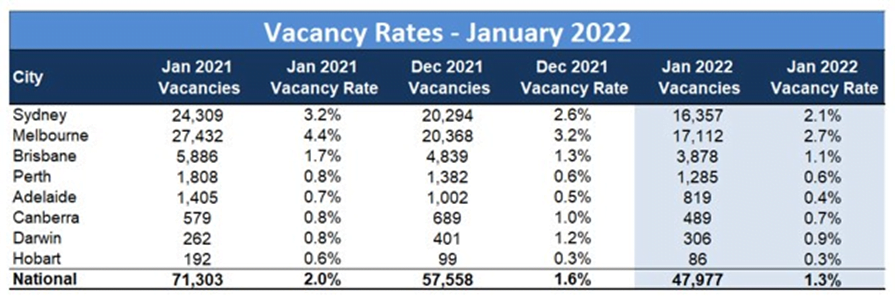
- Vacancy rates have dropped even further to 1.3% nationally in January, which is a 16 year low
- Melbourne has the highest vacancy rate of 2.7%, but this has improved from 3.2% in December.
- Sydney with second highest vacancy at 2.1%, down from 2.6%
- Then Brisbane 1.1%, dropping slightly from 1.3% in December.
- Darwin down to 0.9% in January, following 1.2% in December.
- Canberra 0.7% – down from 1% last month
- Perth – 0.6% – no change since November
- Adelaide dropping to 0.4% after 0.5% the previous month
- Hobart – holding steady at 0.3% from last month.
4. Listings
CoreLogic – (Data published 1 Mar)
- Advertised inventory levels help explain the divergence in housing growth trends.
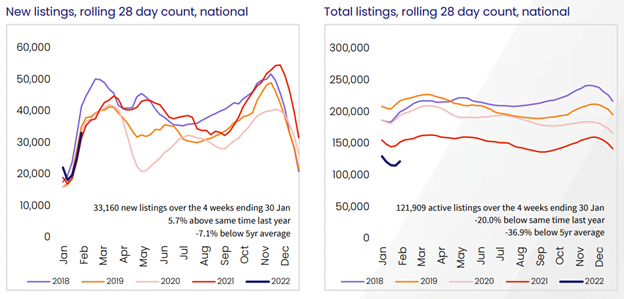
- Nationally, the total number of properties advertised for sale over the four weeks ending 27 February was 13.3% lower than the same period a year ago, demonstrating an ongoing shortage of available housing to purchase, at least at the macro-level.
- Despite the low total listing count, advertised supply levels are gradually normalising after tracking close to 25% below the prior years’ level before spring 2021.
- While some cities, such as Melbourne and Sydney, have seen advertised stock return to more normal levels, other Australian capitals are continuing to record extremely low inventory.
- In Melbourne advertised stock levels are now above average, tracking 5.5% higher than a year ago and 4.7% above the previous five-year average.
- The trend is similar but not quite as advanced in Sydney, with total advertised stock 6.3% higher than last year but still 4.2% below the previous five-year average.
- “The cities where housing values are rising more rapidly continue to show a clear lack of available properties to purchase.
- Total listings across Brisbane and Adelaide remain more than 20% lower than a year ago and more than 40% below the previous five-year average.
- Similarly, the combined rest-of-state markets continue to see low advertised supply, 24.9% below last year and almost 45% below the five-year average,” he said.
- The trend towards higher overall stock levels in some cities can be attributed to a combination of –
- more newly listed properties coming to market
- coupled with a softening in demand caused by worsening affordability,
- higher mortgage rates
- and lower levels of housing-related sentiment.
- The flow of newly listed properties was 1.7% above the previous five-year average.
Total listings
SQM (Data published 1 Mar 2022)
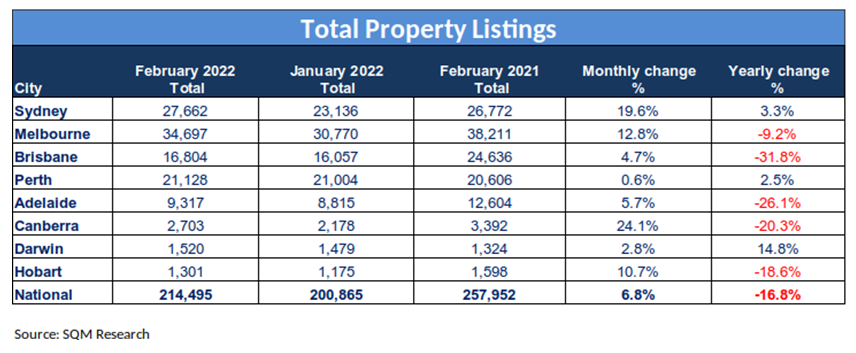
- 8% increase in national listings over February, and down 16.8% over the year. Significant improvement from last month which was down 24.2% over the year
- Total listings the lowest in Brisbane – down 31.8% over the year, then Adelaide 26.1% and Canberra down 20.3%
- Darwin largest increase in annual listings – up 14.8%
- Sydney and Perth both up on annual listings, 3.3% and 2.5% respectively
- Canberra and Sydney the biggest monthly change with Canberra increase of 24.1% over February and Sydney 19.6%
New Listings
SQM (Data published 1 Mar 2022)
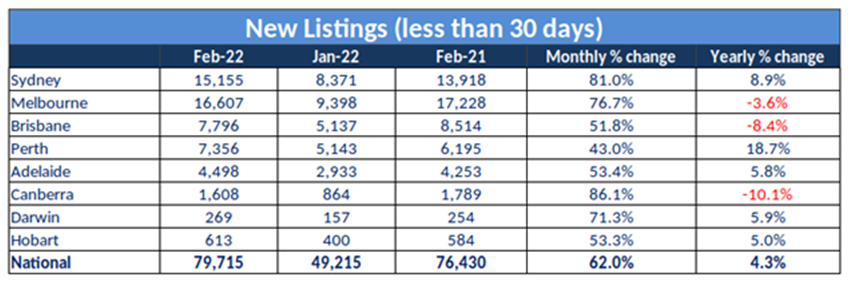
- Over the year listings are up 4.3% nationally
- Largest increase in Perth of 18.7%, then Sydney 8.9%.
- Adelaide, Darwin in the high 5% and Hobart at 5%
- Canberra, Brisbane and Melbourne in negative territory for annual listings
- New listings increased for every capital over February – as expected with the holiday season and return to work.
- Largest increases in
- Canberra – 86.1%
- Sydney – 81%
- Melbourne -76.7%
- Darwin 71%
Old listings
SQM (Data published 1 Mar 2022)
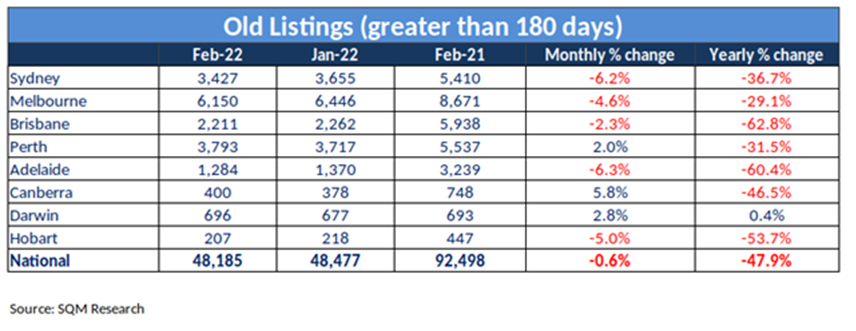
- Decreased 0.6% over February, and down 47.9% over the year nationally
- All capital cities (bar Darwin) listings have decreased in the last 12 months –Brisbane and Adelaide the highest with decreases of 62.8% and 60.4% respectively
- Perth, Canberra and Darwin the only capitals with increases in old listings over February
- Canberra – 5.8%
- Darwin – 2.8%
- Perth – 2%
5. Consumer sentiment – time to buy a dwelling and house price expectations
Westpac Melbourne Institute (Data published 9 Feb)
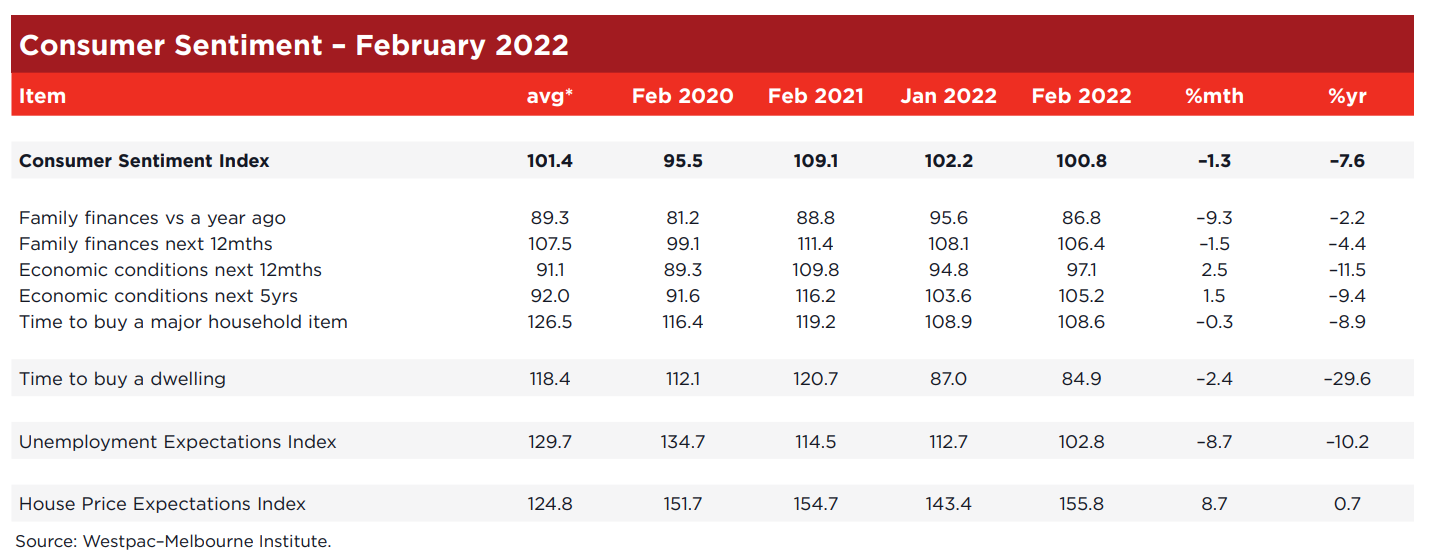
House price expectations index
- Up again above 150, at 155.8 in February, after a dip to 143.4 in January.
- January’s 143.3 reading was the first time since January 2021 that the index was below 150 points
Comments from Westpac Melbourne
- After falling steadily to be down 9.2% over the previous four months, the Westpac Melbourne Institute Index of House Price Expectations recovered by 8.7% in February.
- The gain was across all the major states with
- Victoria recording a particularly strong 19% gain,
- NSW up 4.4%;
- Queensland up 7.1%; and
- Western Australia up 3.6%.
- All state indexes remain at relatively high levels meaning that a strong majority of Australians still expect prices to rise over the next year.
- The results emphasise the sheer resilience of Australia’s housing market.
- Despite consumers being unnerved by higher cost of living and rising interest rates, their confidence in house prices remains solid.
Time to buy a dwelling index
- Down to 84.9 in February, from to 87.0 in January, 81.9 points in December, November, 83.3 points in October, 96.7 points in September, 88.9 in August and July 96.9 points.
Comments from Westpac Melbourne
- The mix of price and interest rate rises is clearly less appealing from a buyer’s perspective.
- The ‘time to buy a dwelling’ index, which is heavily influenced by actual and prospective affordability, fell 2.4% to be 36% below its peak in November 2020.
- All major states recorded falls, reflecting the common expectation that rising prices and interest rate increases will see a further deterioration in affordability.
- Westpac does not expect the first rate hike by the RBA until August and it will be very interesting to observe how resilient this surprising recovery in confidence will be in the lead up to the first move.
- The Reserve Bank Board next meets on March 1. With the Board having decided in February to cease its bond purchase program and the other support measures of Yield Curve Control and the Term Funding Facility having already been curtailed, policy will revert to interest rates.
- At one point markets had been toying with the idea of a rate hike as early as March. They have now backed off but still expect a 25bp increase by June.
6. Lending indicators
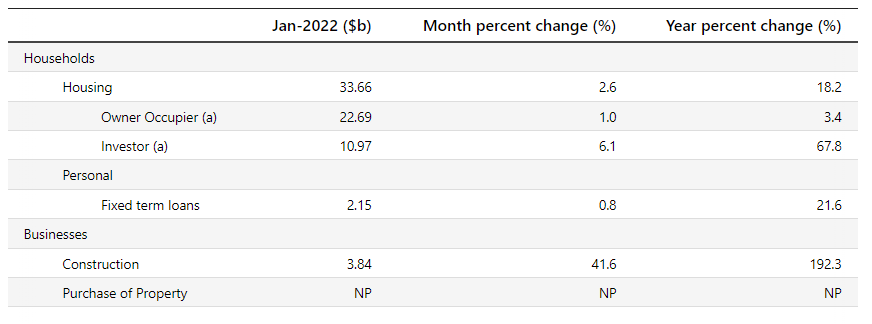
ABS (Data published 1 Mar 2022)
January
- Rose 2.6% for Housing overall
- Increased 1% for owner occupier
- Increased 6.1% for investor
- First home buyers decreased 5.0%
New loan commitments
- % of Owner Occ – 67.4 % (down from 68.5% in December)
- % of Investors – 32.6%(up from 31.5% in December)
- % of first time buyers (as % of owner occ) – 23.7% (down from 25.2% in December)
Investor levels still below where APRA stepped in at 46% in 2015
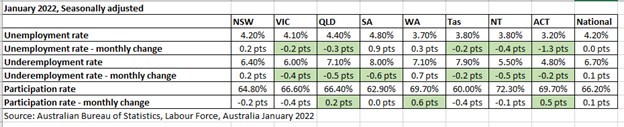
7. Unemployment
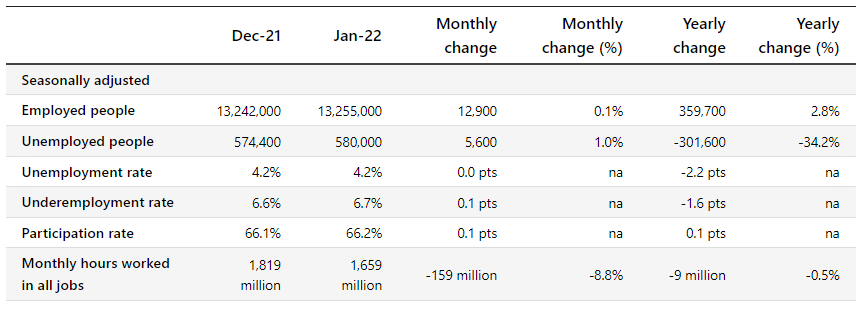
ABS (data published 17 Feb 2022)
ABS (data published 17 Feb 2022)
- Unemployment rate remained at 4.2% over January from December, after 4.6%, in November, and a spike to 5.2% in October.
- Reductions in unemployment in VIC, QLD, Tas, NT, ACT
- Increase 0.9 points in SA
- Underemployment rate increased to 6.7% after 6.6% in December
- Reductions in VIC, QLD, SA, Tas, NT, ACT
- Participation rate slight increase to 66.2% after 66.1% in December
- Increases in QLD, WA and ACT
8. RBA announcement
At its meeting, the Board decided to:
- maintain the cash rate target at 10 basis points and
- the interest rate on Exchange Settlement balances at zero per cent.
RBA minutes
- Economy forecasts
- The global economy is continuing to recover from the pandemic.
- However, the war in Ukraine is a major new source of uncertainty.
- Inflation in parts of the world has increased sharply due to large increases in energy prices and disruptions to supply chains at a time of strong demand.
- The prices of many commodities have increased further due to the war in Ukraine.
- Bond yields have risen over the past month and expectations of future policy interest rates have increased.
- The Australian economy remains resilient and spending is picking up following the Omicron setback.
- Household and business balance sheets are in generally good shape, an upswing in business investment is underway and there is a large pipeline of construction work to be completed.
- Macroeconomic policy settings remain supportive of growth.
- Wages / unemployment
- The resilience of the economy is evident in the labour market, with the unemployment rate at a 14-year low of 4.2 per cent.
- Underemployment is also around its lowest level since 2008.
- Hours worked declined significantly in January due to the Omicron outbreak, but the decline in infection rates and high numbers of job vacancies point to a strong bounce-back over the months ahead.
- The RBA’s central forecast is for the unemployment rate to fall to below 4 per cent later in the year and to remain below 4 per cent next year.
- Wages growth has picked up but, at the aggregate level, is only around the relatively low rates prevailing before the pandemic.
- A further pick-up in wages growth and broader measures of labour costs is expected as the labour market tightens.
- This pick-up is still expected to be only gradual, although there is uncertainty about the behaviour of labour costs at historically low levels of unemployment.
- Inflation
- Inflation has picked up more quickly than the RBA had expected, but remains lower than in many other countries.
- The central forecast is for underlying inflation to increase further in coming quarters to around 3¼ per cent, before declining to around 2¾ per cent over 2023 as the supply-side problems are resolved and consumption patterns normalise.
- The CPI inflation rate will spike higher than this due to the higher petrol prices resulting from global developments.
- How long it takes to resolve the disruptions to supply chains is an important source of uncertainty regarding the inflation outlook, as are developments in global energy markets.
- Financial conditions
- Financial conditions in Australia continue to be highly accommodative.
- Interest rates remain at a very low level, although some fixed rates have risen recently.
- The Australian dollar exchange rate is around its lows of the past year or so.
- Housing prices have risen strongly, although the rate of increase has eased in some cities.
- With interest rates at historically low levels, it is important that lending standards are maintained and that borrowers have adequate buffers.
- Cash rate
- The Board is committed to maintaining highly supportive monetary conditions to achieve its objectives of a return to full employment in Australia and inflation consistent with the target.
- The Board will not increase the cash rate until actual inflation is sustainably within the 2 to 3 per cent target range.
- While inflation has picked up, it is too early to conclude that it is sustainably within the target range.
- There are uncertainties about how persistent the pick-up in inflation will be given recent developments in global energy markets and ongoing supply-side problems.
- At the same time, wages growth remains modest and it is likely to be some time yet before growth in labour costs is at a rate consistent with inflation being sustainably at target.
- The Board is prepared to be patient as it monitors how the various factors affecting inflation in Australia evolve.
9. Wage Price Index
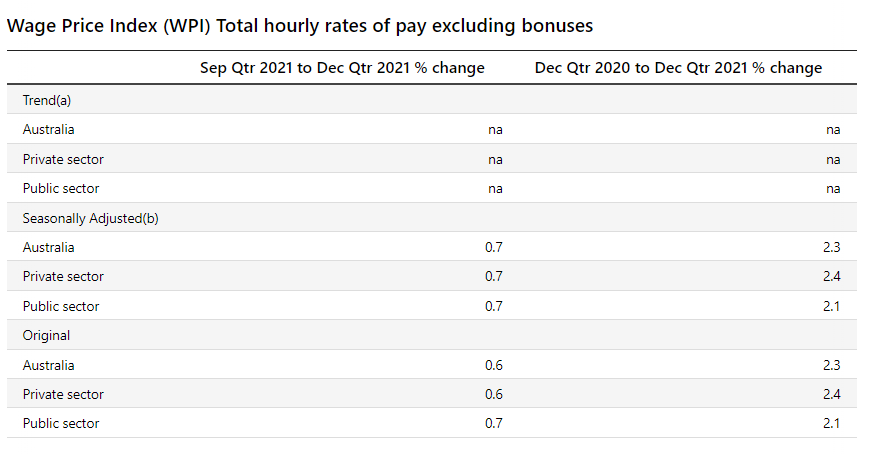
ABS (data published 23 Feb 2022)
December quarter 2021
- Rose 0.7% this quarter and 2.3% over the year.
- The private sector and the public sector both rose 0.7%.
Industries
- Quarterly wage growth – largest increase seen in
- retail trade
- information media and telecommunications
- Annual wage growth – largest increase seen in
- Accommodation and food services
- Retail trade
- Manufacturing
- Rental, hiring and real estate services
States
- Tas with biggest growth in private and public sector
- Second for private is ACT
- Second for public is QLD
- Lowest growth is
- Private – WA
- Public – SA, WA, NT
10. GDP/Savings
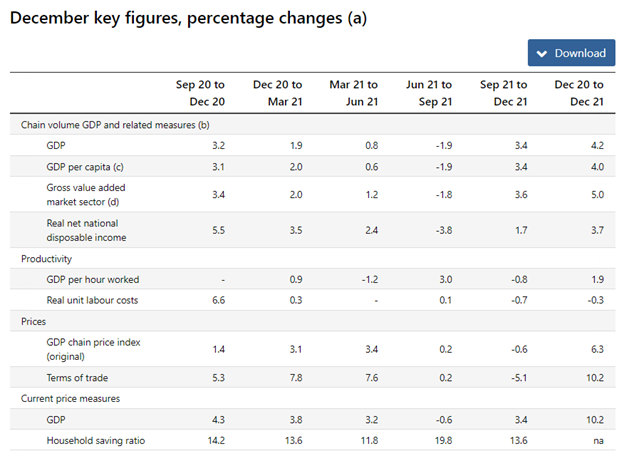
ABS (data published 2 Mar 2022)
December quarter 2021:
- The Australian economy rose 3.4% in the December quarter, after a fall of 1.9% in September quarter in seasonally adjusted chain volume measures.
- NSW, Victoria and the ACT came out of extended lockdowns in October 2021.
- GDP in the December quarter 2021 was 3.4% above December 2019 pre-pandemic levels.
- The emergence of the Omicron variant over the second half of December 2021 did not have a material impact on activity this quarter.
- Household saving ratio decreased to 13.6% in the December quarter, which had risen to 19.8% in the September quarter, from 11.8% in June quarter.
- Household spending rose 6.3% this quarter, recovering from the 4.8% fall in September and exceeding pre-pandemic levels for the first time.
- Spending on services rose 6.3%.
- Hotels, cafes and restaurants (+24.3%),
- recreation and culture (+17.1%) and
- health (+7.9%) rose strongly as movement and trading restrictions lifted.
- Spending on services remains 3.9% below pre-pandemic levels, reflecting continued limitations on certain expenditure items such as travel.
- Spending on goods rose 6.3%. This reflects the pent-up demand for items such as clothing and footwear, furnishings and recreational goods over the lockdown period where non-essential retail stores were closed. Spending on goods was 8.8% above pre-pandemic levels.
If you’d like to discuss your property plans or mortgage strategy, please get in touch with us here.


