1. Home Value Index Results
CoreLogic – (Data published 2 May)
A. National values
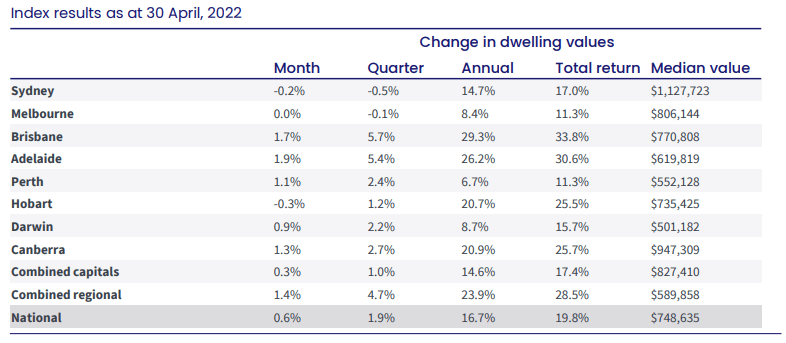
- Australian housing values increased a further 0.6% in April – lowest reading since October 2020.
- Sydney and Melbourne – the heaviest drag on the home value index – first quarter of negative growth territory since extended lockdowns of 2020.
- Sydney housing values recorded the third consecutive month-on-month decline, down 0.2%
- Melbourne values were flat (-0.04% when taken out to the second decimal place).
- Hobart also recorded a negative monthly change (-0.3%), the city’s first monthly fall in 22 months.
- However nationally, 19th consecutive monthly increase in home values.
- Demonstrating the diversity in housing conditions across the broad regions of Australia, half of the capitals are still recording a monthly growth rate above 1% – Brisbane, Adelaide, Perth, Canberra
- Although monthly growth rates remain high in these markets, Mr Lawless warns the trend rate of growth is easing in most of these areas as well. Based on rolling quarterly change,
- Brisbane dwellings moved through a peak rate of growth in December last year at 8.5%, slowing to 5.7% over the most recent three month period.
- Similarly, Adelaide moved through a peak in the trend rate of growth in January at 7.4%, reducing to 5.4% in April.
- Perth and Darwin are the exceptions, where the rolling quarterly trend has gathered some steam since late last year.
- Perth housing values were up 2.4% over the three months ending April compared with a recent lull through late last year when the quarterly trend fell to just 0.4%.
- “A rebound in migration rates as state and international borders re-opened could partially explain the renewed exuberance, along with persistently low advertised stock levels and strong economic conditions,” Mr Lawless says.
- “While ABS internal migration data by greater capital city is currently only reported to June 2021, the data points to a vast uplift in internal migration to Perth for the year (6,468), a substantial turn-around from the previous four-year average (-3,735).”
- Annual change – Above 20% – Brisbane 29.3%, Adelaide 26.2%, Canberra 20.9%, Hobart 20.7%,
- Canberra overtakes Hobart
- Annual change – below 20% – Sydney 14.7%, Darwin 8.7%, Melbourne on 8.4%, and Perth 6.7%
B. Month Highlights
Growth over April
- National – 0.6% – remains positive across all capitals except Hobart, Sydney and Melbourne
- Combined capitals – 0.3% after 0.3% last month
- Combined regionals – 1.4% after 1.7% last month
- Adelaide – 1.9% after 1.9% last month
- Brisbane – 1.7% after 2.0% last month
- Canberra – 1.3% after 1.0% last month
- Perth – 1.1% after 1.0% last month
- Darwin – 0.9% after 0.8% last month
- Melbourne – 0.0% after negative 0.1% last month
- Sydney – negative 0.2% after negative 0.2% last month
- Hobart – negative 0.3% after 0.3% last month
Median values – ALL DWELLINGS
- National – $738,975
- Combined capitals – $818,307
- Combined regional – $577,987
- Capitals –
- Sydney – $1,116,889
- Canberra – $932,704
- Melbourne – $805,232
- Brisbane – $749,293
- Hobart – $731,849
- Adelaide – $602,717
- Perth – $542,338
- Darwin – $494,635
C. Regions
- Regional Australian housing markets have been somewhat insulated from the slowdown, with housing values up 1.4% in April across the combined regionals index, compared with a 0.3% gain across the combined capitals.
- Advertised stock levels remain 42% below the previous five-year average in the regions, while the volume of home sales is holding 20% above the previous five-year average.
- The imbalance between available supply and demonstrated demand is a key factor supporting growth in housing prices across Regional Australia, however the trend rate of growth is generally slowing as affordability constraints become more challenging.
- The annual growth trend in home values is now falling sharply, with the national reading dropping from a recent peak of 22.2% growth over the year ending November 2021, to 16.7% over the most recent 12-month period.
- As the stronger months of capital gain from early 2021 fall out of the 12- month calculation, Mr Lawless says we will see the annual change reducing more sharply over the coming months
2. Rents
CoreLogic – (Data published 2 May)
- Nationally
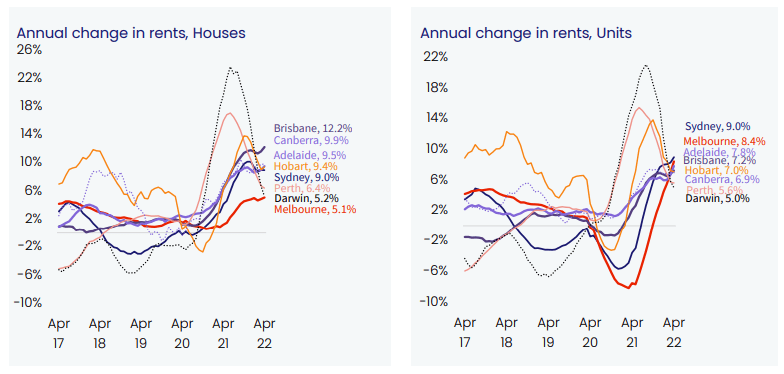
- Rental markets are also showing multi-speed conditions, with most of the capital cities experiencing an upward trend in rental growth in 2022.
- Nationally, rents were up 2.7% over the three months to April, taking the annual change in national rents to 9.0%.
- A year ago, the annual change in national rents was 4.9%.
- Houses vs units
- Based on the annual change, house rents (+9.1%) are rising faster than unit rents (+8.7%),
- However this trend is changing sharply as demand for unit rentals increases.
- “On a rolling quarterly basis, we are now seeing unit rents rising faster than house rents especially in Sydney and Melbourne where rental conditions across the unit sector were previously much softer,” Mr Lawless says.
- “The shift in rental demand towards units reflects both rental affordability pressures, which are deflecting more demand towards the ‘cheaper’ unit sector, and the return of overseas migrants and visitors.
- Rental demand from overseas arrivals tends to skew towards inner city and higher density precincts.”
- In Sydney, unit rents were up 3.0% over the three months ending April, a full percentage point higher than the rise in house rents (2.0%).
- In Melbourne, the difference is starker, with unit rents 3.6% higher over the past three months compared with a 1.2% rise in house rents.
- Rental yields
- The rolling quarterly change in rents is now outpacing the rolling quarterly change in housing values across most of the capital cities, which is supporting a rise in gross rental yields.
- Nationally, housing values were up 1.9% over the most recent three month period, while rents increased 2.7%.
- The result is a subtle 2 basis point increase in the gross yield.
- However, in Melbourne, the gross yield has lifted by 7 basis points from a recent low and Sydney gross yields are up 9 basis points from the recent low.
- Despite the upwards trend, gross yields in both these cities remain well below historic averages at just 2.5% and 2.8% respectively.
- Investors
- Higher yields and long-term prospects for capital growth could see investors comprising a larger portion of housing market activity.
- Financial aggregates published by the RBA to the end of March showed the monthly gain in investor credit growth was at the highest level since August 2015, with the speed of investment credit growth surpassing owner occupier credit for the first time since December 2016.
3. Vacancy rates
SQM (Data published 12 Apr)
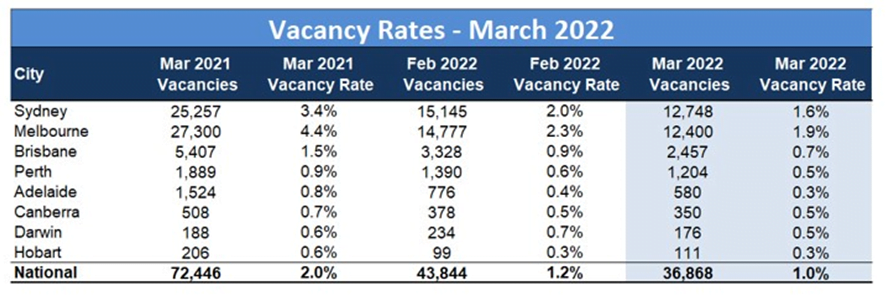
- National residential property rental vacancy rates fell to 1% in March 2022, down from 1.2% in February 2022.
- This represents half the total number of vacancies reported as of twelve months ago and the lowest national vacancy rate since 2006.
- Melbourne has the highest vacancy rate of 1.9%, but this has improved from 2.3% in February.
- Melbourne CBD – fell from 2.8% to 2.4%
- Sydney with second highest vacancy at 1.6%, down from 2.0%
- Sydney CBD – fell from 4.3% to 3.4%
- Then Brisbane 0.7%
- Perth, Canberra, Darwin – 0.5%
- Adelaide, Hobart – 0.3%
4. Listings
CoreLogic – (Data published 2 May)
TOTAL listings
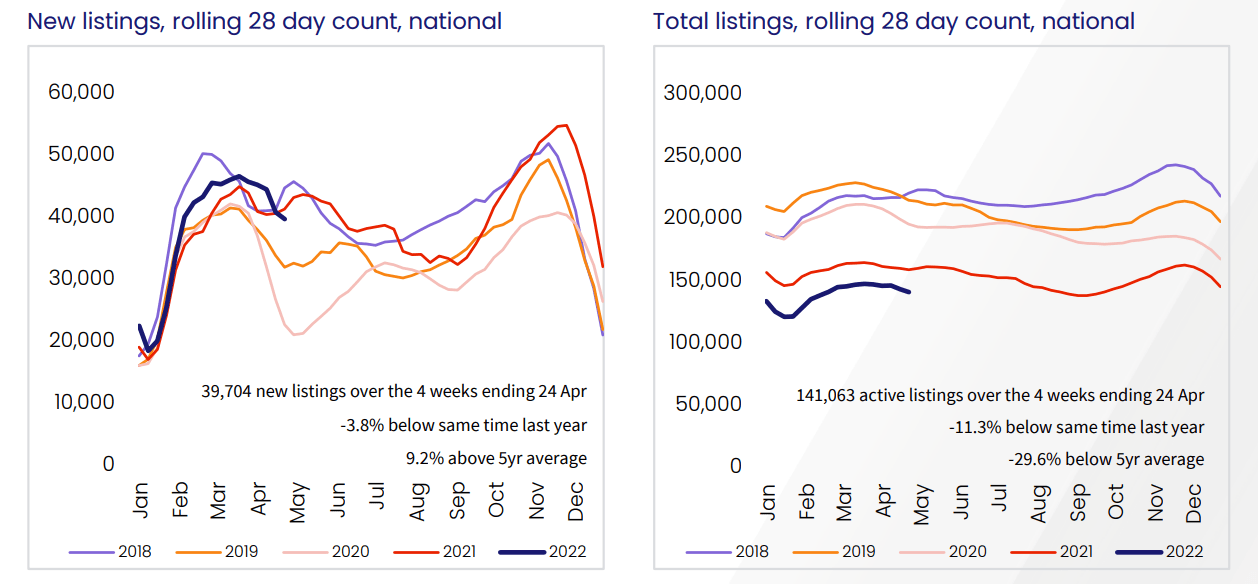
- 8% increase in national listings over March, and down 14.9% over the year.
- Persistently low levels of property listings help to explain the strength across the smaller capitals and regional markets.
- Advertised inventory, at a national level, is tracking almost 30% below the previous five-year average over the four weeks ending April 24 at the national level.
- However, a more detailed analysis of each capital city highlights significant differences in the total number of homes available to purchase.
- Brisbane and Adelaide – Total advertised inventory is more than 20% below levels from a year ago in Brisbane and Adelaide, and around 40% lower than the previous five-year average in both cities.
- In weaker markets like Melbourne and Sydney, advertised supply levels have normalised.
- Sydney advertised stock levels are roughly in line with the previous five year average, while listings in Melbourne were 8.2% higher.
- In Hobart, where April’s -0.3% decline follows 22 consecutive months of growth, stock levels started to increase in the middle of March.
- “With higher inventory levels and less competition, buyers are gradually moving back into the driver’s seat.
- That means more time to deliberate on their purchase decisions and negotiate on price,” Mr Lawless says.
- Softening buyer demand can be seen in fewer home sales.
- The trend in housing turnover peaked at a record high through the December quarter last year.
- Estimated sale settlements since have fallen, with the quarterly number of home sales nationally estimated to be 14.0% lower relative to the same time a year ago.
NEW listings
- Brisbane and Adelaide – The flow of new listings has generally been higher than normal in these markets; the shortage of available housing inventory in these markets is more due to a rapid rate of absorption as homes sell quickly amidst high demand.
- Sydney and Melbourne – Higher stock levels across these markets can be explained by an above average flow of new listings coming on the market in combination with a drop in buyer demand.
- Hobart – The new listing count is now 46% higher over the four weeks to April 24 compared to the same period in 2021.
5. Consumer sentiment – time to buy a dwelling and house price expectations
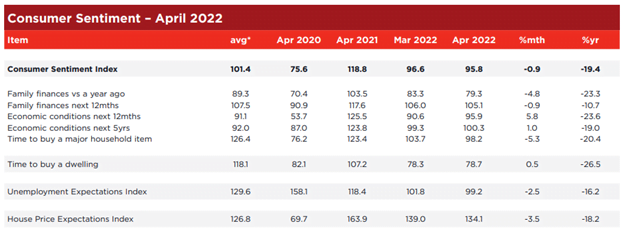
Westpac Melbourne Institute (Data published 13 Apr)
A. House price expectations index
- Drop to 134.1 points, after 139 in March.
Comments from Westpac Melbourne
- Most consumers still expect prices to rise over the next 12 months but the view is becoming less widespread.
- At the index peak of 163.9 a year ago, 70% of consumers expected prices to rise.
- Today that proportion has declined to a little over half (54.5%).
- Notably, the balance has tipped a lot further in NSW and Victoria with state index reads in the low 120s and less than half of consumers in these states expecting prices to rise in the year ahead.
- Both state indexes recorded sizeable falls in April: NSW is down 9.5% and Victoria by 12.3%.
- That follows recent updates showing prices in Sydney and Melbourne have flat-lined since late last year.
B. Time to buy a dwelling index
- Down to 78.7 in April, after 78.3 in March
- From July 2021 the index has been hovering from the low 80’s to high 90’s.
Comments from Westpac Melbourne
- The ‘time to buy a dwelling’ index nudged 0.5% higher but was coming off a 14-year low in the previous month and around 40% below its most recent peak in November 2020.
- High prices, rising fixed mortgage rates and the expectation of rises in variable mortgage rates continue to weigh on affordability and confidence in the housing sector.
6. Lending indicators
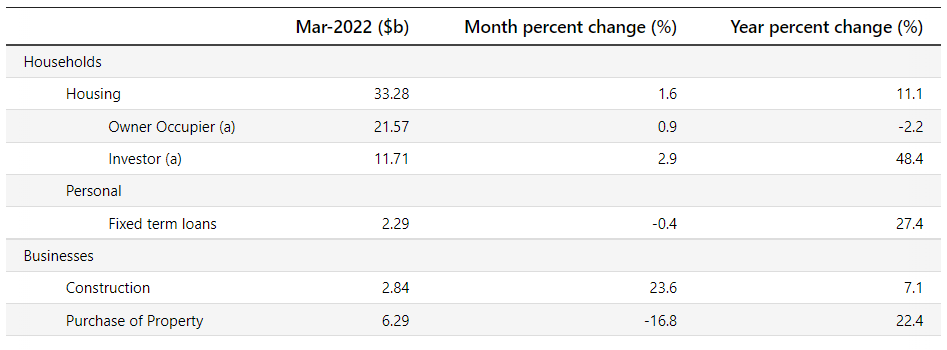
ABS (Data published 4 May 2022)
March
- Rose 1.6% for Housing overall
- Rose 0.9% for owner occupier
- Rose 2.9% for investor
- First home buyers increased 5.9%
New loan commitments
- % of Owner Occ – 64.8% (down from 66.7% in February)
- % of Investors – 35.2% (up from 33.3% in February)
- % of first time buyers (as % of owner occ) – 23.6% (up from 22.5% in February)
Investor levels still below where APRA stepped in at 46% in 2015
7. Unemployment
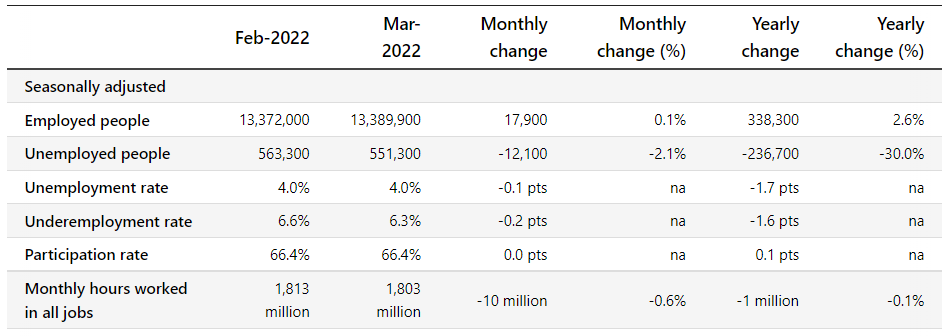
ABS (data published 14 Apr 2022)
March
- Unemployment rate remained 4.0%
- Reductions in unemployment in VIC, QLD, SA, WA
- Underemployment rate decreased to 6.3% after 6.6% in February
- Reductions in all states except SA
- Participation rate remained at 66.4%
- Increases in NSW, SA, ACT
8. RBA announcement
At its meeting, the Board decided to:
- increase the cash rate target by 25 basis points to 35 basis points.
- increased the interest rate on Exchange Settlement balances from zero per cent to 25 basis points.
RBA minutes
Cash rate rise
- The Board judged that now was the right time to begin withdrawing some of the extraordinary monetary support that was put in place to help the Australian economy during the pandemic.
- The economy has proven to be resilient and inflation has picked up more quickly, and to a higher level, than was expected.
- There is also evidence that wages growth is picking up.
- Given this, and the very low level of interest rates, it is appropriate to start the process of normalising monetary conditions.
Unemployment
- The resilience of the Australian economy is particularly evident in the labour market, with the unemployment rate declining over recent months to 4 per cent and labour force participation increasing to a record high.
- Both job vacancies and job ads are also at high levels.
- The central forecast is for the unemployment rate to decline to around 3½ per cent by early 2023 and remain around this level thereafter. This would be the lowest rate of unemployment in almost 50 years.
Economic growth
- The outlook for economic growth in Australia also remains positive, although there are ongoing uncertainties about the global economy arising from: the ongoing disruptions from COVID-19, especially in China; the war in Ukraine; and declining consumer purchasing power from higher inflation.
- The central forecast is for Australian GDP to grow by 4¼ per cent over 2022 and 2 per cent over 2023. Household and business balance sheets are generally in good shape, an upswing in business investment is underway and there is a large pipeline of construction work to be completed.
- Macroeconomic policy settings remain supportive of growth and national income is being boosted by higher commodity prices.
Inflation
- Inflation has picked up significantly and by more than expected, although it remains lower than in most other advanced economies.
- Over the year to the March quarter, headline inflation was 5.1 per cent and in underlying terms inflation was 3.7 per cent.
- This rise in inflation largely reflects global factors.
- But domestic capacity constraints are increasingly playing a role and inflation pressures have broadened, with firms more prepared to pass through cost increases to consumer prices.
- A further rise in inflation is expected in the near term, but as supply-side disruptions are resolved, inflation is expected to decline back towards the target range of 2 to 3 per cent.
- The central forecast for 2022 is for headline inflation of around 6 per cent and underlying inflation of around 4¾ per cent; by mid 2024, headline and underlying inflation are forecast to have moderated to around 3 per cent.
- These forecasts are based on an assumption of further increases in interest rates.
Wages growth
- The Bank’s business liaison suggests that wages growth has been picking up. In a tight labour market, an increasing number of firms are paying higher wages to attract and retain staff, especially in an environment where the cost of living is rising.
- While aggregate wages growth was subdued during 2021 and no higher than it was prior to the pandemic, the more timely evidence from liaison and business surveys is that larger wage increases are now occurring in many private-sector firms.
- Given both the progress towards full employment and the evidence on prices and wages, some withdrawal of the extraordinary monetary support provided through the pandemic is appropriate.
Government bonds
- Consistent with this, the Board does not plan to reinvest the proceeds of maturing government bonds and expects the Bank’s balance sheet to decline significantly over the next couple of years as the Term Funding Facility comes to an end.
- The Board is not currently planning to sell the government bonds that the Bank purchased during the pandemic.
Future rate increases
- The Board is committed to doing what is necessary to ensure that inflation in Australia returns to target over time.
- This will require a further lift in interest rates over the period ahead.
- The Board will continue to closely monitor the incoming information and evolving balance of risks as it determines the timing and extent of future interest rate increases.
9. CPI
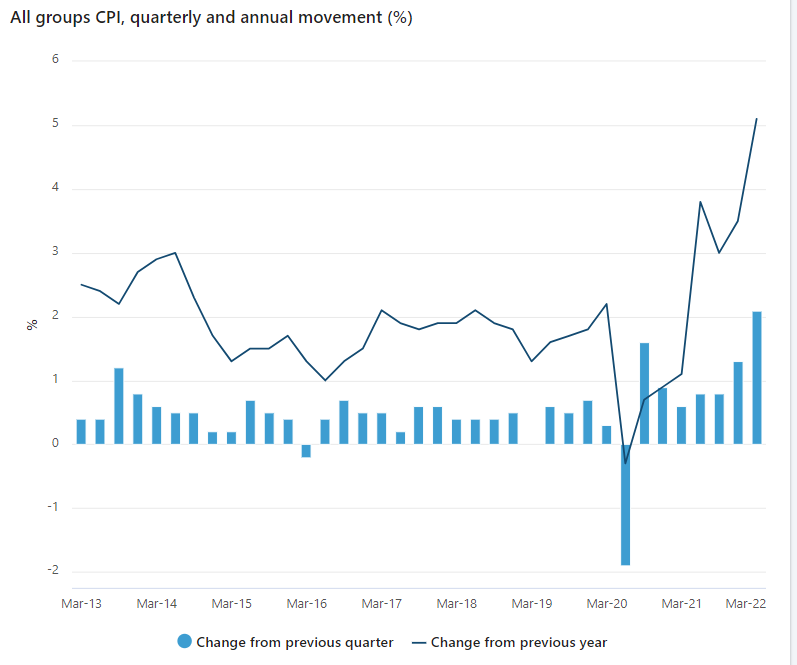
ABS (data published 27 Apr 2022)
- Inflation is the highest in more than two decades and underlying inflation highest since 2009
- The Consumer Price Index (CPI) rose 2.1% this quarter.
- Over the twelve months to the March 2022 quarter, the CPI rose 5.1%.
- Higher dwelling construction costs – 5.7%
- Automotive fuel prices – 11%
- Trimmed mean annual inflation, which excludes large price rises and falls, increased to 3.7 per cent, the highest since March 2009.
If you’d like to discuss your property plans or mortgage strategy, please get in touch with us here.


