Listen and subscribe
 Android
1. Nationally a 1% median price reduction was our smallest rate of decline since June last year
All falls for capital cities were also less than their falls last year – an interesting observation considering the unwelcome December rate increase. Cate draws attention to the Sydney median price now sitting below one million dollars, and she also highlights the variability between data houses, and the need for consumers to track data consistently from the same source if they are comparing months. The trio consider market segmentation and the need to note that all property types rarely perform in synchronisation.
Dave points that overall national prices are down overall 8.9% over the last twelve months – hardly a statistic that matches some of the doom and gloom predictions we saw floating about last year.

Source: CoreLogic
2. Melbourne’s median value may fall to below the pre-pandemic level in the coming month – an interesting one to watch!
But many of the other capital cities seem likely to remain above their last pre-COVID peaks.

Source: CoreLogic

Source: CoreLogic
3. Unit rents are still climbing in many cities, and while house asking rents have slowed their pace of growth somewhat, the rate of growth is still positive across the board. Units asking rents in every state remain problematic for renters.
Combined with net overseas migration reaching a record high, the threat to the rental market undersupply issue is further amplified by the announcement from the Chinese Government for overseas students to return to their place of study. A large number of Chinese students are forecast to arrive in our capital cities very soon and our concern for unit rentals is likely to be well founded.

Source: CoreLogic
4. Tighter rental vacancy rates – the majority of our capital cities (for both houses and units) are exhibiting further tightening rental yields.

Source: CoreLogic
5. New listings are still low after a particularly quiet spring season nationally
As Pete points out, we didn’t see the drops we anticipated from December and throughout Jan due to our demand/supply ratio being healthier than feared. However, our new listing activity is 24.5% lower than the five year national average and buyers at the coalface are experiencing this first hand. Cate sheds light on a leading indicator; agent appraisal activity and she explains the correlation and the concern that buyers are justified in feeling as we inch closer to our autumn market. Unless listing activity increases substantially, buyers can anticipate competition and we may see prices increasing in some market segments. We can certainly anticipate this placing a floor under price falls.

Source: CoreLogic
6. Sales activity – people are still buying, but sales volumes are low. Pete explores what factors lead vendors to make the decision to sell in this climate.

7. What’s changed since our last rate increase? Things aren’t quite as dire as some may have guessed they’d be… tune in to hear more.
Dave segues perfectly into our economic conditions and consumer sentiment changes.
Consumer confidence tells a couple of interesting stories this month. While confidence is still low, the two metrics of interest are; a) house price expectations index, and b) family finances next twelve months. This suggests that household concerns about finance are not worse than November despite a rate increase, and the majority of those polled expect house prices to increase.
Cate and Dave talk about consumers anticipating the rate rises, particularly this time round for February’s rate increase. When people look to plan ahead, visibility counts for everything. Perhaps consumers feel the point of cash rate equilibrium is getting closer? The trio believe so.

Source: Westpac Melbourne Institute
8. 30% less people are borrowing for housing – no wonder the banks are being so competitive!
Unsurprisingly, refinance activity is very strong in response to three things; increasing interest rates, and hungry banks as a result of this lending reduction. Happily the trio can report a softening in personal debt (ie. unsecured debt).

Source: ABS
9. Our bond yields tell a compelling story – and Dave points out the visibility that these yield overviews enable us.
The three year bond yield remains sub 3.2 still; and digesting this in tandem with longer term bond yields shows us that we’re reasonably close to the likely cash rate equilibrium.
Pete reminds us how pleased he is for his students who are finding work more easily than past years.

Source: investing.com
10. Unemployment continues to stay at historically low levels.
Cate suggests that we haven’t seen the impact yet of new arrivals, and the trio remind listeners of the possible instability that could be felt as technology companies in the US continue to reduce staff and cull jobs.

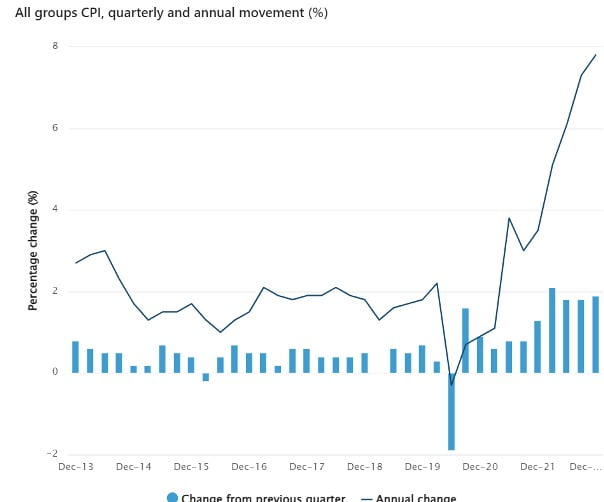
11. Inflation continues to plague us; particularly house prices.
Although Cate notes that recreation and culture haven’t really diminished. “We’re still having a good time!” A COVID hangover perhaps? FOMO? Likely. But it remains an issue while our RBA tries to tackle inflation.


Gold Nuggets
Cate Bakos – The Property Buyer’s Golden nugget: Cate raises an important lender offering that some buyers may wish to know more about. Some lenders are now providing three month preapprovals that are not subject to change, regardless of interest rate movements within the validity period.
David Johnston – The Property Planner’s Golden nugget: One for our maths brains…. Dave talks about property value rises and falls and the way that buyers sometimes misunderstand percentage movements. A ten percent rise is not the same as a ten percent reduction! It’s a simple analogy, but one that so many get wrong.


