
Listen and subscribe
Apple  Android
In this week’s episode, Dave, Cate and Pete take you through:
1 Regional areas vs capital cities
- Generally speaking – houses have outperformed units and capital cities have outperformed regionals
- More volatility for capitals, much more stable for regionals.
- Although combined capitals houses, it’s only if you’ve held it over the 30 years. If you’ve needed to sell, there’s greater likelihood that you could suffer greater loss because of that fluctuation.
- Don’t get too caught up in the short term.
- Everything was even until 97 – then started to have a divergence. Units trackinga long with regions up until 2007. Then capital units started to go above, but now they are just touching. Will they cross over?

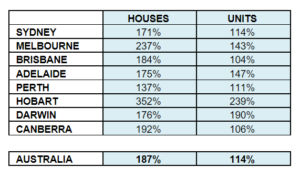
2 Houses vs unit growth in our capital cities from March 2002 to December 2021
- Hobart – houses and units have outperformed other capital cities.
- Darwin bucks the trend – what do we put that down to – when you go to the finer grain data, the reason why median price for units outperforms prices, urban renewal or construction of new high rise apartments.
- Brisbane and Canberra extremely low growth for units.
- Canberra – you would think because Canberra property prices are second only to Sydney, more people more interested in buying units than houses. Salaries are higher in Canberra than other capitals. People are going for houses in Canberra, because their salaries allow them to do that. Canberra have the highest percentage of people with university degrees.
- There tends to be a lot of younger people in Canberra, go there to progress their career – 20 and 30 year olds.
- Especially in government or working with government.
- Canberra being a smaller town, even if living on the edges, only a 30 min drive to get to the city. Remote location but commute is very small.
3 How have the Property Professor’s top suburbs performed?
- When looking at the ata, it’s important to remember two things which could skew the view:
- Urban renewal
- Data integrity due to low sales volumes or brand new units released
- Geelong – houses 89.5%
- Units are in negative
- In Melbourne houses that have outstripped 100% -gentrification
- The units that have performed well – over 70% – due to Melbourne renewal
- QLD
- Units have dropped in value in Herston – there wasn’t much urban renewal. Showing what second hand units do over a long period of time
- Urban renewal $500,000
- Significant influx of well speced up, median to high density, worth $700,000, that reflects a growth in unit value so it distorts the numbers to suggest that there has been capital growth.
- Albion, Annerley and Woody point –
- Darwin’s performance over the last 12 years has not been great, that’s been reflected in the property prices. Comparing with Darwin, they did well, but nationally they have not done well.
- Sydney more demand for units than any of the other capital cities.


