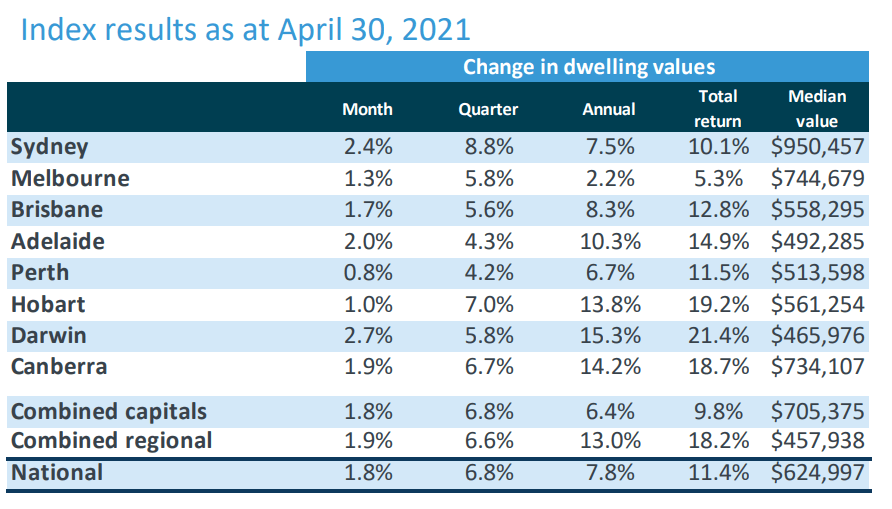
 The April property index has landed and, as expected, the property market subsided. The market is still hot, but not setting records not seen since 1988, as March did.
 Here are the key takeaways:
- The national market increased by 1.8%, a significant drop from March’s 2.8%, but still a hot annualised growth rate of 21%.
- Combined regionals slightly outperform combined capitals with 1.9% vs 1.8%. Combined capitals edged ahead for the quarter though at 6.8% growth V 6.6%. We’ll continue to watch this closely as we expect the cities margin could widen over the year.
- Darwin shows the highest growth in April, clocking in 2.7% and has the largest growth over the last 12 months at 15.3%. For perspective, the current median of$465,976 is still well beneath its May 2014 peak of $578,825.
- After a surge of 3.7% in March, Sydney home values increase by 2.4% in April, for a whopping 8.8% over the quarter. That is an annualised rate of 35%. It’s worth noting that Sydney values grew by 50% in 1988, so this kind of growth over a year isn’t unique.
- Adelaide surged by 2% or annualised growth of 24% and is now in 10% growth territory over the last 12 months, joining Darwin, Canberra and Hobart.
- Canberra, Brisbane, Melbourne and Hobart all return strong growth of above 1%.


