How Interest Rate Cycles Have Shaped the Australian Property Market Since 1990
Updated: Oct 1

Do interest rate movements actually impact the property market?
In this episode, the Property Trio sink their teeth into cash rate data going back to 1990 to answer that exact question.
David sets the scene with a brief history of why the Australian dollar was floated in 1983, before the Reserve Bank began targeting the cash rate seven years later in 1990, a decision that has had a powerful influence on mortgage rates ever since.
The trio then unpack every rate cycle since, what happened to property values and the broader economy, and finish with their own predictions for where things head next.
Floating the Australian dollar and targeting the cash rate
In 1983, the Australian dollar was floated to give the Reserve Bank more control over money supply, a policy known as money targeting. Prior to the float, Australia experienced significant volatility in domestic monetary conditions. Seven years later, in January 1990, the RBA began targeting the cash rate, the rate charged on overnight loans between banks, which has a powerful influence on other rates in the economy, including mortgages. This gave the Reserve Bank the ability to influence economic conditions directly, rather than being entirely at the whim of international markets.
New Zealand was actually the first country to announce interest rate targets in 1990, with other nations, including Australia, soon following suit. NZ was also the first to formally target inflation that year, with Australia adopting the same approach in 1993.
Since 1990, Australia's average cash rate has sat at 4.70%, dropping slightly to 4.05% if you measure from 1993 onwards. Notably, there's far less volatility in interest rates than there is in the property market itself.
Cash rate cycles since 1990
Since the RBA began targeting the cash rate, Australia has lived through five rate lowering cycles and four full rate tightening cycles, with a fifth tightening cycle now underway. Here's what happened in each.
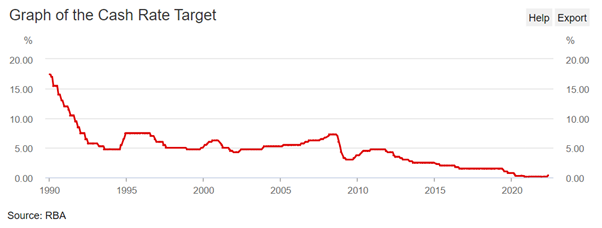
The first lowering cycle ran from January 1990, when rates peaked at 17 to 17.5%, down to 4.75% by July 1993, a reduction of almost 13 percentage points over three and a half years. It coincided with Australia's worst recession in decades: unemployment climbed from 6.1% to 10.9% over the same period. Despite this, median property values only grew by around 2% annually from 1990 to 1994. The lesson here is an important one: a lot of fear exists around what happens to property prices when rates move, but the data shows there's far more than just interest rates at play.

Rates then rose sharply in the first tightening cycle, from 4.75% to 7.5% between August and December 1994, before holding at that peak for around a year and a half. Despite high unemployment and volatile rate movements, property prices still grew by 7% annually over this period.

The second lowering cycle, from July 1996 to December 1998, saw rates fall from 7.5% to 4.75% over roughly two and a half years. Property values again grew by 7% annually, reinforcing that there was still no clear correlation between falling rates and accelerating growth.
The second tightening cycle, running from November 1999 to August 2000, saw rates rise from 4.75% to 6.25%. This period coincided with the introduction of the GST and an expanded First Home Owner's Grant, and property prices responded strongly, growing at an annualised rate of 18%. If there's one factor that correlates more closely with property values than interest rates, it's government stimulus.
The third lowering cycle was brief, just 11 months from February to December 2001, taking rates from 6.25% down to 4.25%. Property values grew by a striking 28% annually over this period, despite unemployment and inflation both ticking upward, an unusual combination that still isn't fully understood.

What followed was the longest tightening cycle on record: nearly six years, from May 2002 to March 2008, with rates climbing from 4.25% to 7.25%. Unemployment actually fell over this period, from 6.4% to 4.1%, while property values grew by 7.2% annually. Once again, rising rates alone didn't appear to derail the market.
The fourth lowering cycle, from September 2008 to April 2009, coincided with the Global Financial Crisis, with rates cut sharply from 7.25% to 3% in just eight months. Despite widespread fears the market would crash by as much as 40%, property values actually grew by 8% annually over the following two years, buoyed by government stimulus. It's a reminder that overseas commentators often underestimate how strongly Australians are attached to home ownership.
The fourth tightening cycle followed quickly, with rates rising from 3.75% to 4.75% between October 2009 and November 2010. Property values were essentially flat over this period, dipping by around 1% annually from 2010 to 2012.
The fifth and longest lowering cycle then began in November 2011 and ran all the way through to November 2020, nearly a decade, with rates falling from 4.75% to just 0.1%. Average property values grew by 6.7% annually over this period, a little softer than some earlier cycles, which challenges the common assumption that falling rates automatically supercharge growth.
The booms are bigger than the busts
Looking across the last 34 years, the pattern becomes even clearer. The three largest annual increases in capital city house prices were 32.9% in 1988, 18.4% in 2002 and 19.3% in 2003. By contrast, capital city house prices have only fallen on three occasions in that time: by 4.1% in 2008, 4.4% in 2011 and 5.5% in 2018. The size and frequency of the booms simply dwarf the busts, which is an important consideration when building a long-term property plan rather than reacting to short-term sentiment.

Managing the property cycle
Understanding historical rate cycles is useful, but knowing how to actually behave through a cycle matters more. Whether you're buying during a downturn, holding through a correction, or navigating a booming seller's market, managing the property cycle well comes down to your personal economy and long-term plan, not short-term sentiment. It also means knowing the difference between a buyer's and seller's market, and why riding out a downturn usually beats crystallising a loss.
The Property Trio's Gold Nuggets
David Johnston, the Property Planner
Points out that across history, rate lowering cycles have averaged 2.92 years while tightening cycles have averaged 2.04 years. His key takeaway is that property prices aren't significantly affected by the length of a tightening cycle on their own, there are simply too many other factors pushing and pulling on values at the same time. He'd be very surprised to see an overall reduction in values of more than 10% in the current cycle, particularly given how critical the property market is to the broader Australian economy.
Peter Koulizos, the Property Professor
Agrees that a 15 to 25% drop in prices is unlikely. With low unemployment and a strong economy, he doesn't expect every capital city to fall in value, noting that cities like Brisbane and Adelaide have grown by almost 30% and would need a significant correction just to return to flat.
Understanding how these cycles have historically played out is one part of the puzzle. Knowing how a potential rate change affects your own borrowing capacity is just as important when deciding whether, and when, to make your next move.
Need a hand?
If you'd like to talk through what the current rate cycle might mean for your own property plans, or how to make decisions based on your personal economy rather than short-term rate movements, reach out to us.
Our support, service and advice is ongoing and continues throughout your property journey, whatever the cycle is doing.